

TL;DR
- HYPE trades inside a bullish ascending triangle, with higher lows pressing against the $50 resistance.
- Assistance Fund buybacks remain close to market levels, reducing supply and steadying price action.
- Exchange net outflows show tokens leaving platforms, easing selling pressure and helping stabilize HYPE.
Ascending Triangle Takes Shape
HYPE/USDT 12-hour chart is showing an ascending triangle, a structure traders often associate with bullish setups. The formation is marked by horizontal resistance near $49–$50 and a trendline of higher lows that has been in place since late July.
Crypto analyst BATMAN said,
“$HYPE is forming a textbook bullish ascending triangle pattern. Each day it’s compressing more and more, so let’s hope we get one more retest toward the bullish trendline before it breaks out.”
The asset has retested the rising support several times, with buyers stepping in at higher levels.
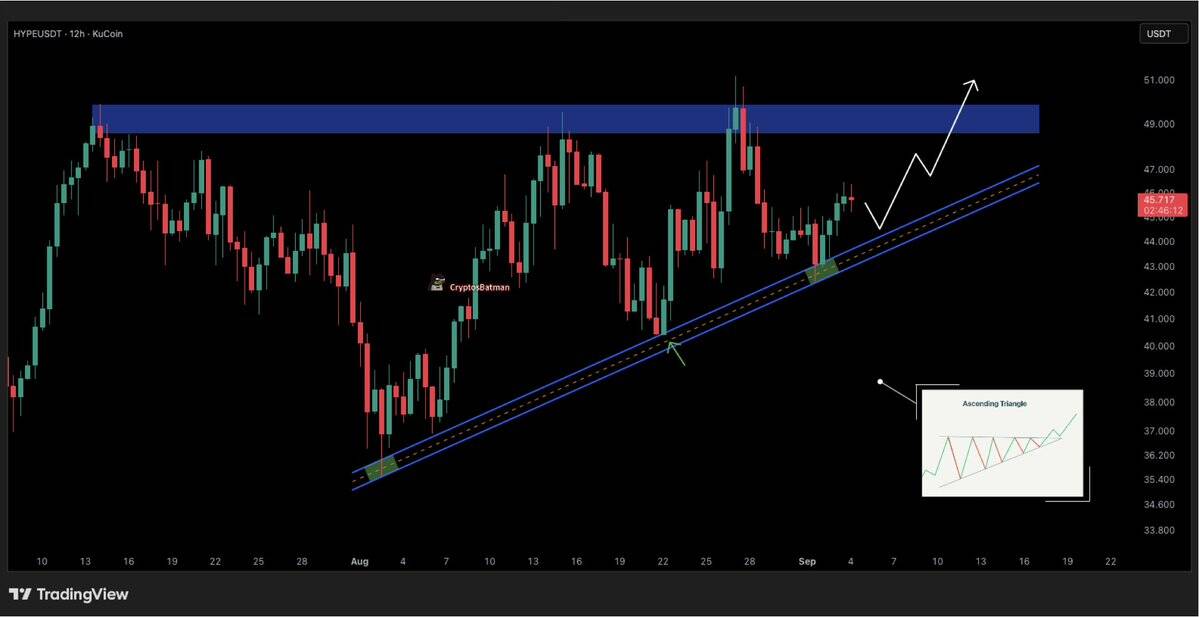
A breakout above $50 would confirm the pattern, while a breakdown below the trendline would weaken it. For now, the structure remains intact and points to possible continuation.
Market Price and Trading Volume
Hyperliquid (HYPE) was trading at $46 at press time, with a 24-hour volume of $270.6 million. The token is up slightly over the last day and 4% across the past week. Its price continues to move within the consolidation range that has held through most of the summer.
David Schamis, partner at Atlas Merchant Capital, noted in an interview with Bloomberg,
“The exchange (Hyperliquid) generates revenue and buys the token every day…A massive burn rate, unlike BTC or ETH.”
He was referring to the buyback program, which has already removed more than 30 million HYPE from circulation.
Notably, figures comparing daily closes with Assistance Fund buybacks show the program closely aligned with market levels. On September 4, HYPE closed at $46 while the average buyback price stood at $45 for 56.98K HYPE.
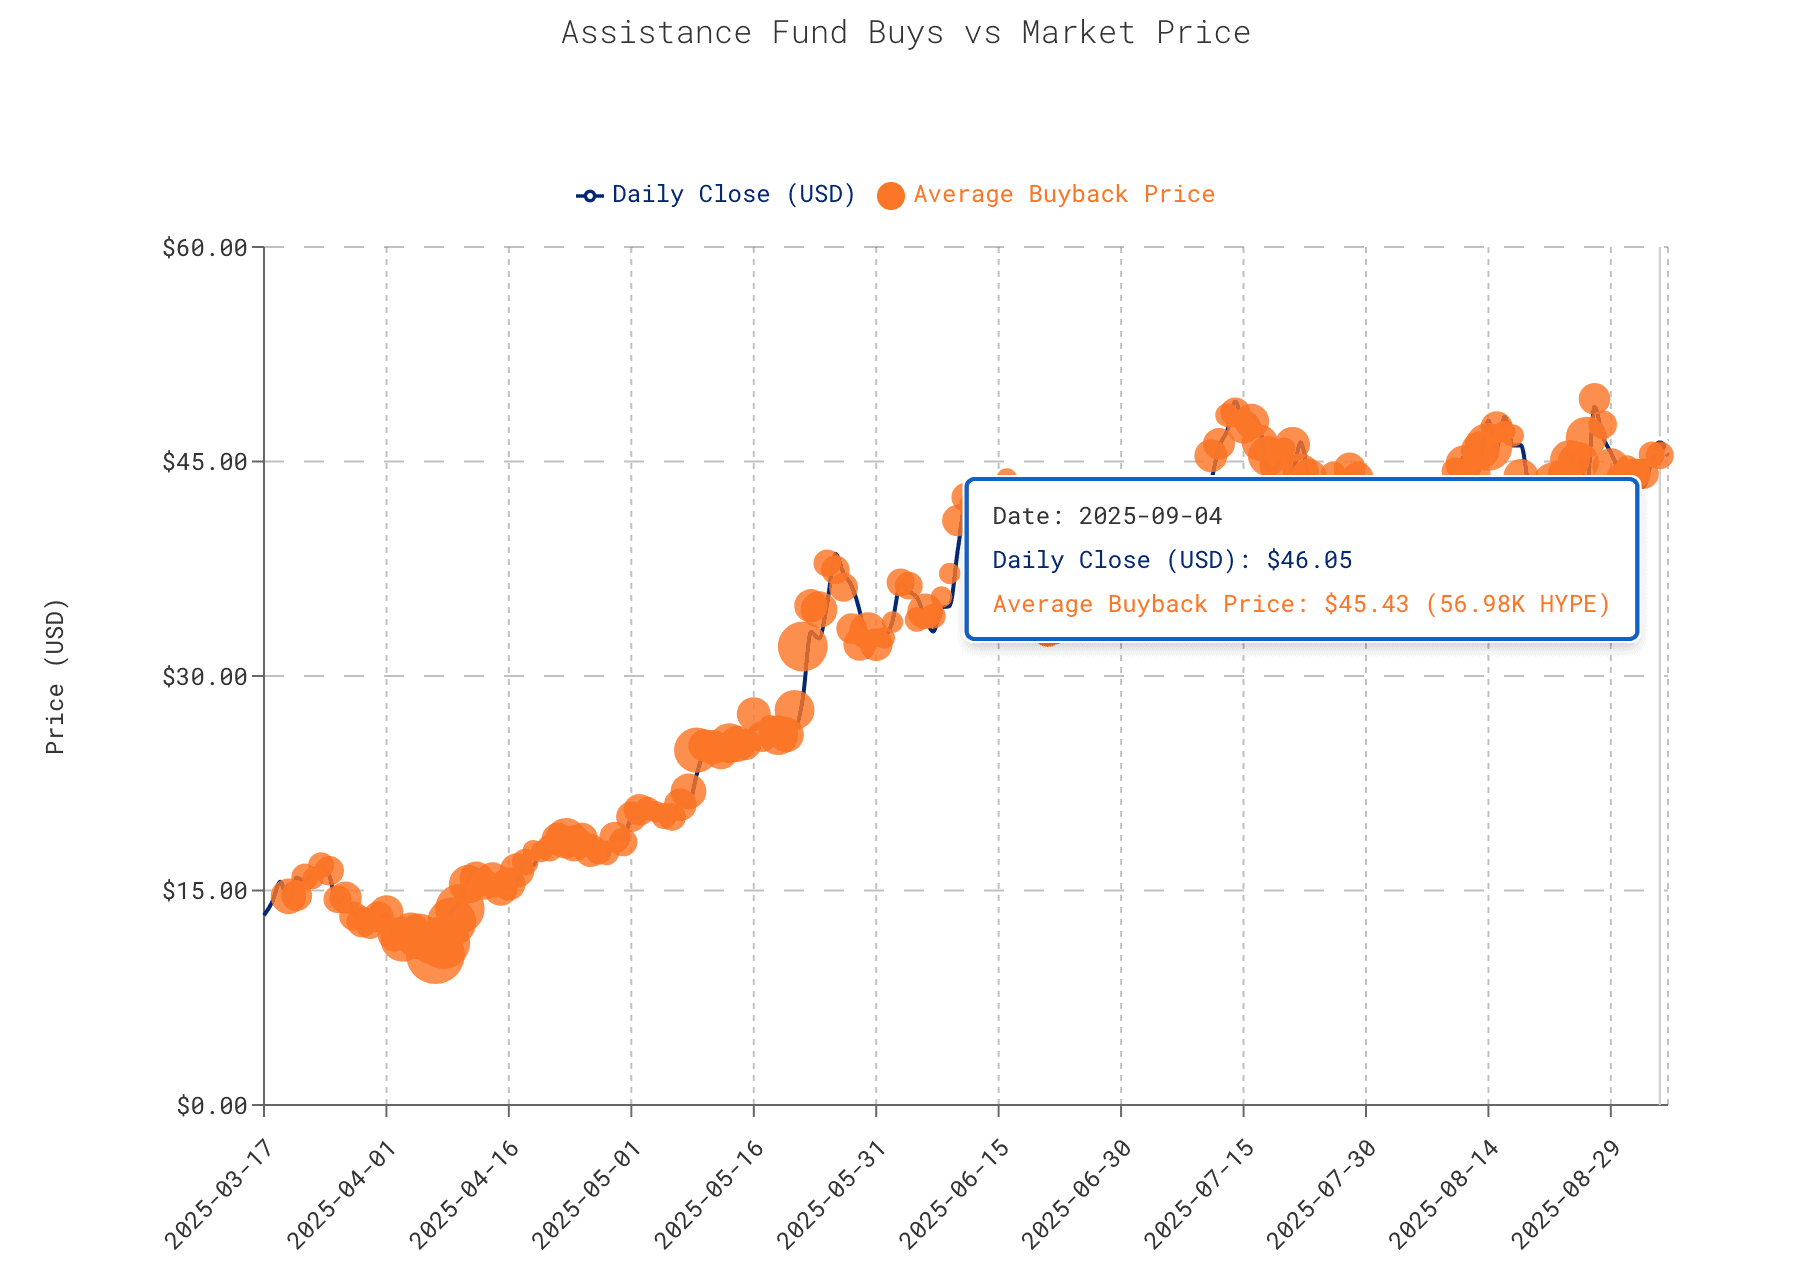
Since March, the token fell as low as $12 before recovering. By May, it crossed $30 and has since consolidated between $40 and $50. The alignment of buyback levels with the price indicates steady support during this period.
Exchange Flow Data Shows Outflows
Spot flow data compares inflows and outflows with the price from July to early September. HYPE traded between $33 and $50 during this time, peaking near $51 in late August before stabilizing in the mid-$40s.
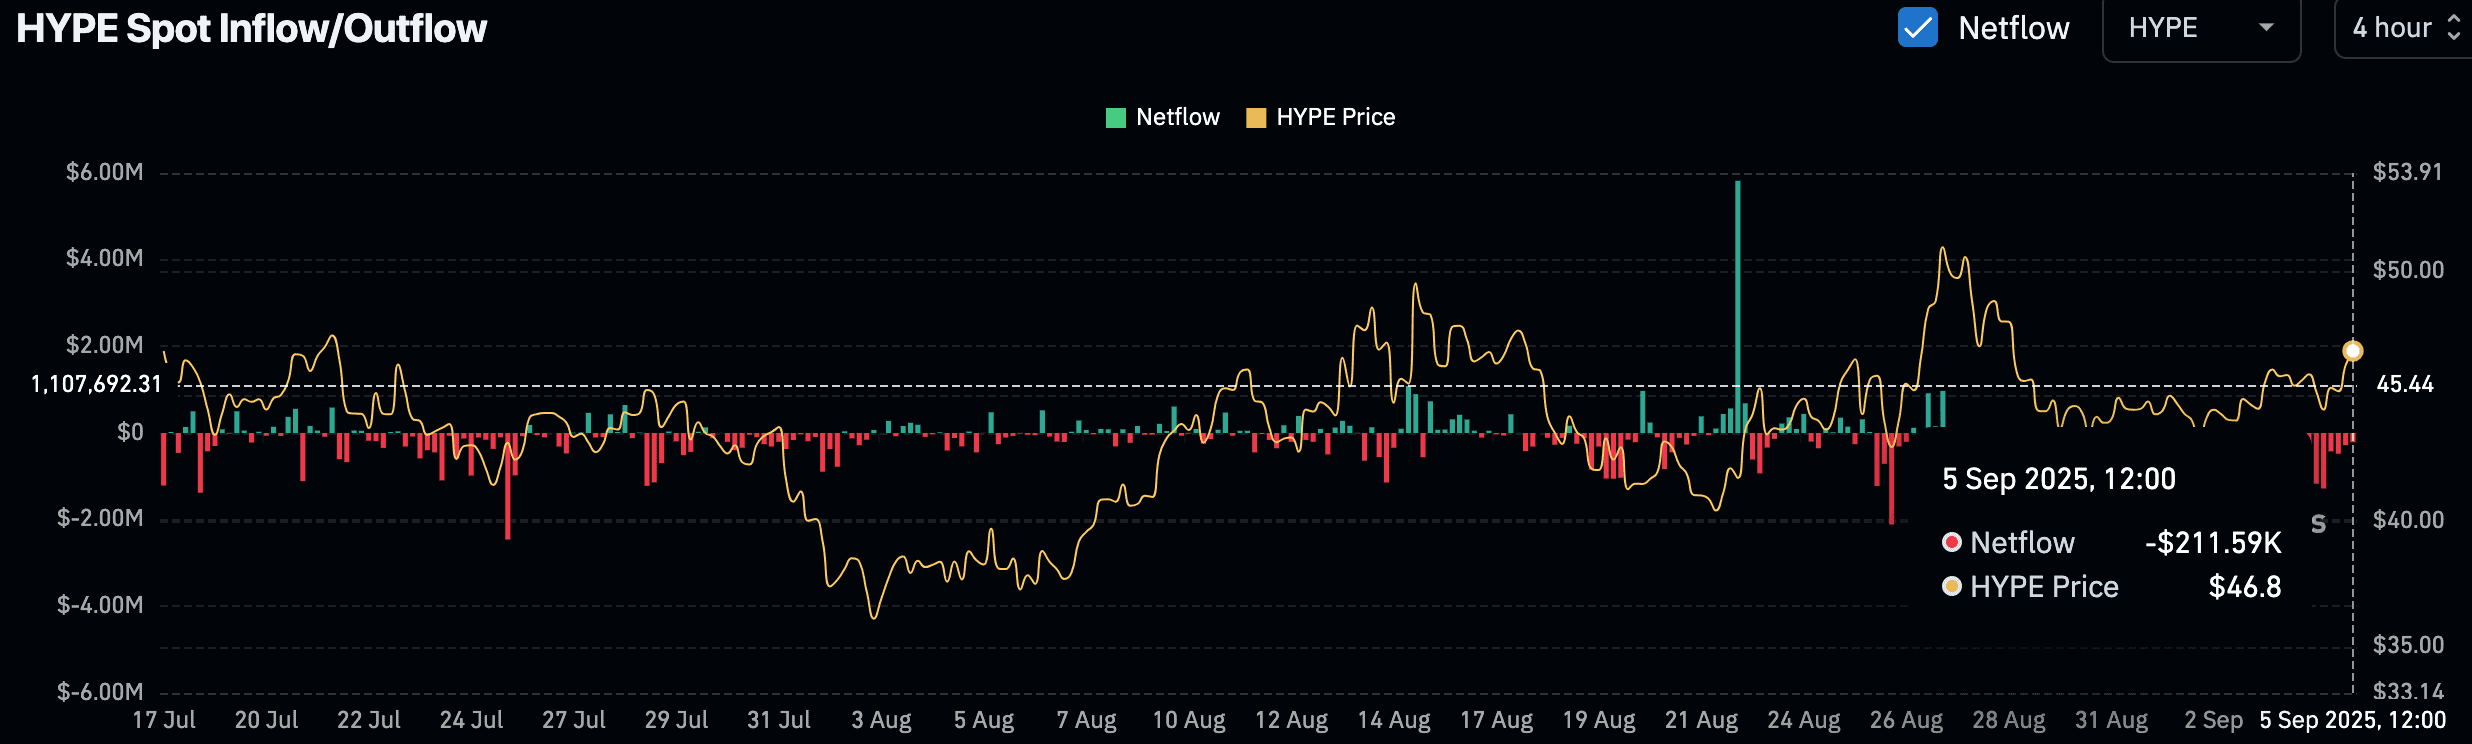
Netflow activity stayed close to neutral but showed occasional spikes. A major inflow was seen on August 21, while September 5 recorded an outflow of nearly $212K. The recent outflows suggest tokens are leaving exchanges, easing short-term selling pressure and supporting stability around current levels.
The post Is HYPE Set for a $50 Breakout? Chart Says Yes appeared first on CryptoPotato.
