

Tron (TRX) has captured investor attention once again with major developments surrounding its future. On Monday, Nasdaq-listed SRM Entertainment (SRM.O) confirmed a strategic agreement with Tron founder Justin Sun. The deal will see SRM acquire Tron tokens, rebrand itself as “Tron Inc.,” and onboard Sun as an adviser, effectively bringing Tron closer to becoming a publicly traded entity. This marks a historic shift for the blockchain industry and positions Tron in a unique space among crypto projects.
However, the market backdrop is anything but calm. Rising geopolitical tensions in the Middle East have sparked sharp volatility across risk assets, including Tron. While the token’s price has fluctuated significantly, long-term metrics suggest underlying strength in the network.
According to new CryptoQuant data, TRON’s total daily energy consumption—an important measure of smart contract execution and user activity—has surged 108% year-over-year. It now sits at 200 billion energy units per day, compared to just 77 billion a year ago. Notably, 80% of this demand originates from staked TRX, indicating robust participation in the protocol and a significant increase in smart contract interactions. Together, these factors underscore Tron’s growing relevance as both a technical platform and a public-facing blockchain enterprise.
Tron Trades Near Key Demand Amid Broader Market Pullback
Tron is currently testing key demand levels after a 9% correction from its recent high near $0.295. The price had briefly surged on Monday after the announcement of Tron’s plans to go public through a deal with Nasdaq-listed SRM Entertainment. However, the excitement was short-lived. As macroeconomic uncertainty deepens and Middle East conflicts escalate, the entire crypto market has entered a retracement phase, dragging TRX below the levels it traded at prior to the news.
Despite the challenging conditions, on-chain fundamentals paint a much more resilient picture. CryptoQuant data shows that Tron’s network activity remains robust, with energy consumption—used to execute smart contracts—up 108% year-over-year. Total daily energy usage now exceeds 200 billion units, compared to just 77 billion at the same time last year.
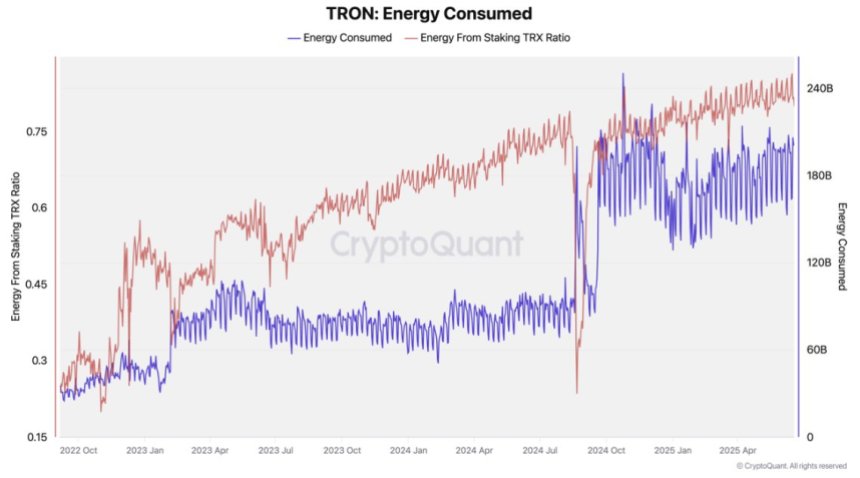
This surge in energy use signals growing demand for on-chain operations and smart contract execution. Importantly, about 80% of this energy demand comes from staked TRX, pointing to strong user commitment to the network and increased participation in decentralized applications.
The divergence between TRX’s on-chain strength and its current price performance suggests that the recent pullback may be more about broader market stress than any deterioration in Tron’s fundamentals. If volatility stabilizes, these robust activity metrics could help position Tron for a strong recovery.
TRX Price Holds Trendline Support Despite Volatile Reversal
Tron is currently trading at $0.2730, showing a modest 9% pullback from the $0.295 high reached earlier this week following the announcement of a deal involving SRM Entertainment. Price action in the chart reflects this volatile reaction—after spiking, TRX retraced sharply and is now consolidating just above the 50-day moving average (blue line), which has acted as dynamic support over the past two months.

Despite this pullback, the structure remains bullish. TRX continues to respect the long-term ascending trendline formed since early March, with higher lows being maintained. Volume surged during the initial rally on the announcement but has since returned to pre-news levels, indicating fading short-term hype and a return to fundamentals.
Looking at the broader setup, the 100-day and 200-day moving averages (green and red lines) remain sloped upward, reflecting sustained long-term momentum. The $0.269–$0.253 support band, defined by these MAs, will be key if further downside pressure materializes.
A break above $0.295 would invalidate this short-term pullback and potentially ignite a move toward $0.32. Conversely, failure to hold the trendline could trigger a deeper retracement. For now, TRX holds structure—yet caution remains warranted given broader market uncertainty.
Featured image from Dall-E, chart from TradingView
