

As geopolitical tensions between Iran and Israel escalate once again, global risk appetite is taking a hit. These conflicts often inject short-term volatility across traditional and crypto markets, and Ethereum is no exception.
While ETH has held relatively steady above $2,500 in recent weeks, the growing fear in macro markets is beginning to surface in price structure and sentiment shifts.
This is a sensitive moment for traders: ETH sits on the edge of a critical range, and what happens next may hinge as much on external events as technical factors.
Technical Analysis
By ShayanMarkets
The Daily Chart
Ethereum’s daily chart shows a clear rejection from the $2,800 resistance area, which also aligns with the 200-day moving average and a bearish order block. After a strong relief rally from the $1,500 region earlier this quarter, ETH consolidated in an ascending channel pattern but is now likely to break below the lower trendline of that channel.
This structure typically signals exhaustion in bullish momentum, especially when the market fails to push higher despite favorable short-term setups. The RSI has also dropped back under the 50 mark, reflecting bearish momentum.
The price is now re-entering the mid-range zone, between $2,800 and $2,150. If Ethereum fails to reclaim $2,800 soon, the door will open for a possible move back toward the $2,150 support level, which coincides with the 100-day moving average and the top of the last major accumulation range. A bounce from there would be critical to preserve the broader bullish bias in recent months.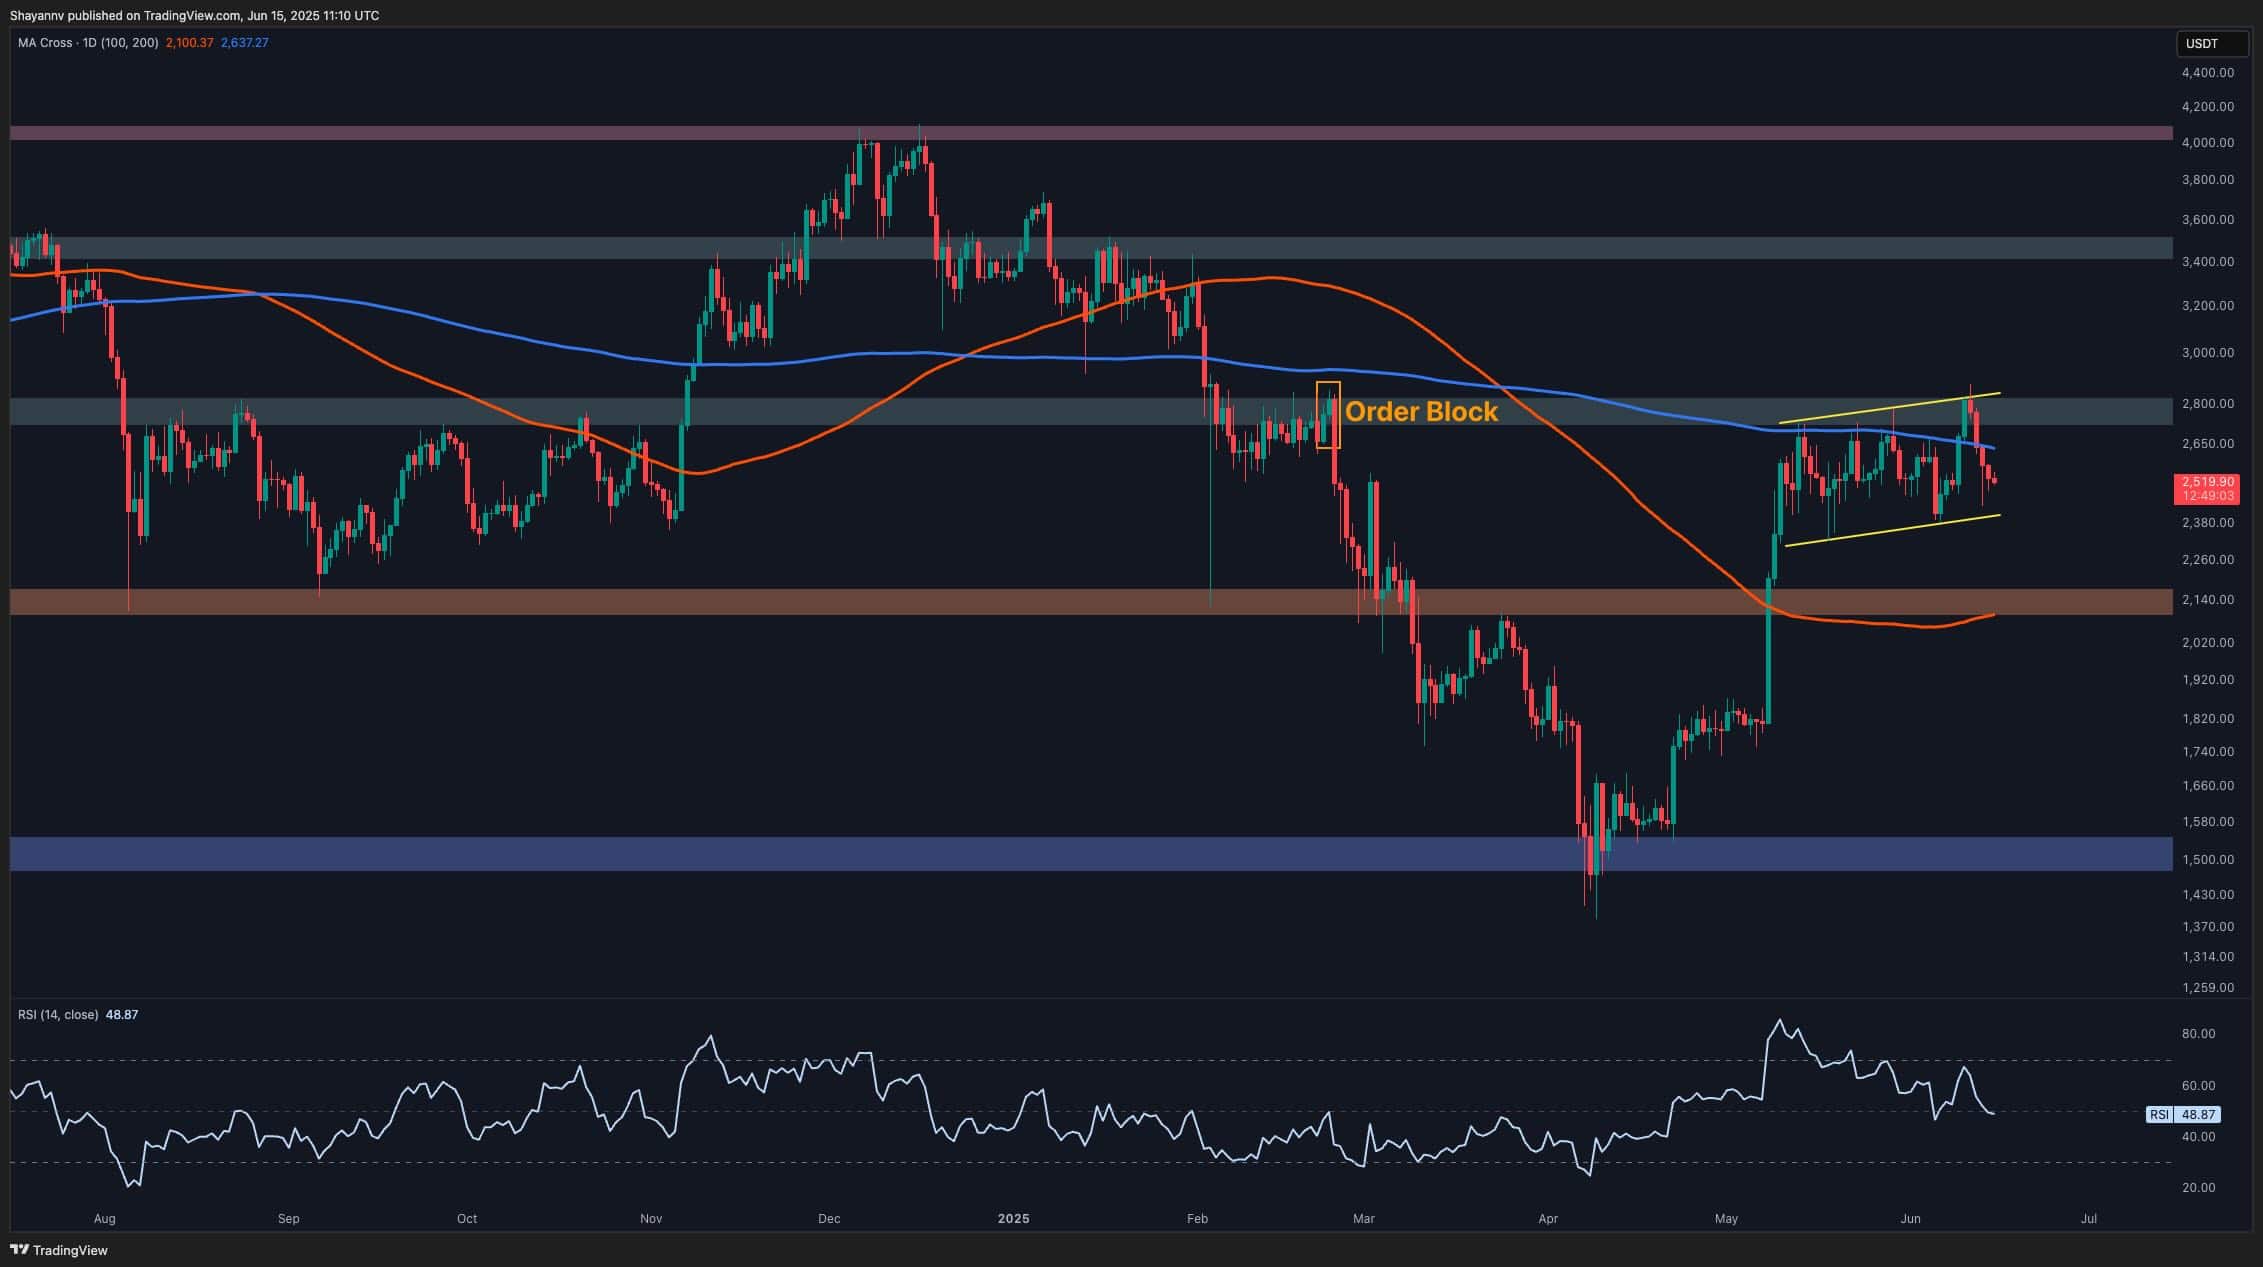
The 4-Hour Chart
On the 4H chart, the asset has broken down from the ascending channel it had been respecting for weeks. The rejection from the $2,800 order block created a sharp drop that left behind an imbalance (FVG) near the $2,600 zone, currently acting as short-term resistance. The structure now resembles a potential distribution phase, particularly if the price breaks below the channel without fresh buying pressure.
The RSI also remains weak, hovering just below 50, and shows no signs of bullish divergence. There is also a notable lack of volume on recent bounces, suggesting that demand is drying up as macro uncertainty looms. If the channel breakdown occurs, ETH could retrace toward the $2,300 demand zone. Holding that area would be crucial, as losing it could invite a deeper correction toward $2,100, where stronger bullish interest likely awaits.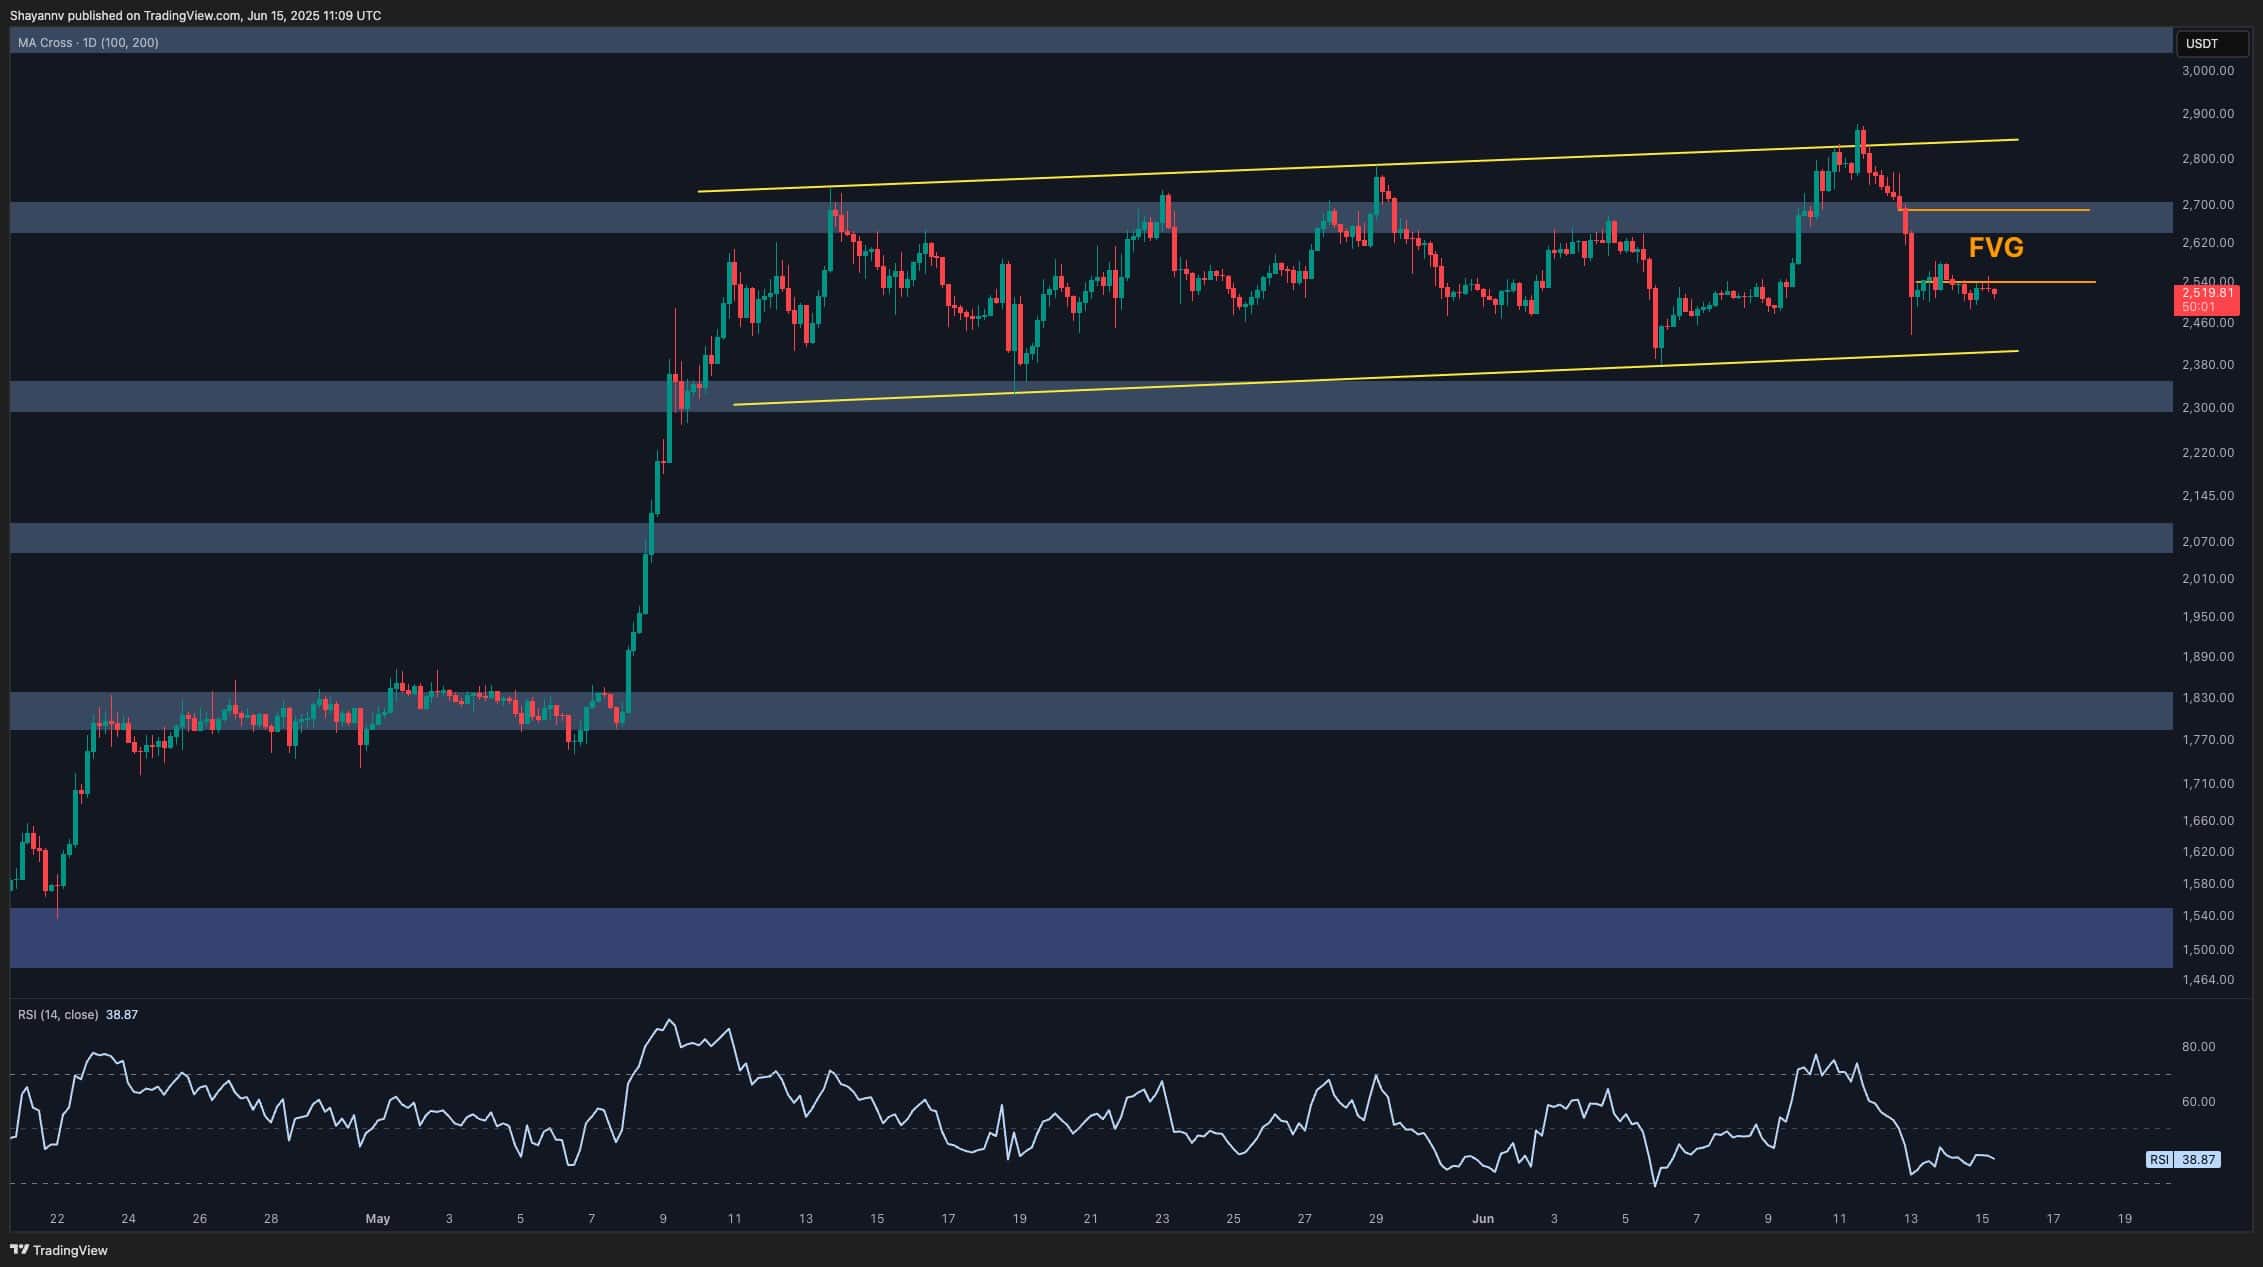
Sentiment Analysis
Open Interest (OI) on Ethereum derivatives has briefly reached its highest point over the past couple of years, exceeding $21B, before experiencing a marginal drop due to the liquidity caused by the tensions in the Middle East. What makes this development even more interesting is that this surge in OI is occurring while ETH is trading significantly lower than it did the last time OI was this elevated.
This divergence typically signals a buildup of leveraged positions—both long and short—that are yet to be flushed out of the system.
Historically, such OI-price divergence often precedes large-scale liquidation events. If the market can’t generate a clean breakout soon, a volatility spike triggered by the unwinding of over-leveraged positions could happen. This aligns with the growing geopolitical risk, which could catalyze a fast repricing if global investors move to risk-off assets. In other words, derivatives are flashing a warning. Even if the price looks calm, the undercurrent is anything but stable.
The post Ethereum Price Analysis: ETH at Critical Juncture After $2.5K Support Retest appeared first on CryptoPotato.
