

Crypto analyst Doctor Profit has risen in fame for making multiple near-perfect calls for the Bitcoin price. He had predicted the Bitcoin decline from $109,000 back down and then called a bottom at $77,000, predicting the BTC price would bounce to new all-time highs, which it did. Now, with the Bitcoin price recoiling from hitting a new all-time high above $111,000, the crypto analyst is back with next steps and where the cryptocurrency could be headed from here.
Why The Bitcoin Price Golden Cross Matters
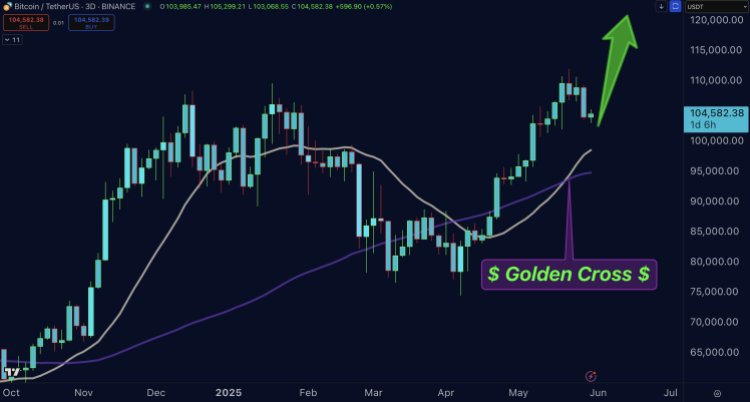
In his X post, Doctor Profit starts out by explaining the psychology of the current market, calling out those who continue to call out for a bear market. He refers to these people as ‘exit liquidity’ for the real players, hinting that they’re wrong for their stance. Rather, he points out an important formation in the Bitcoin price chart and that is the Golden Cross, which appeared last week.
The analyst calls the appearance of this Golden Cross “a macro-level signal with historic accuracy.” He explains that since this signal is so rare, but has been right every time, there is no reason to deviate from it. Also, he further explains that the Golden Cross has always been a long-game signal. Hence, results are not expected to start showing so early.
The Golden Cross pattern had appeared on the weekly chart, and the crypto analyst highlights its historical accuracy. Each time that the Bitcoin price has formed this Golden Cross, it has usually led to a multi-month rally. If this is the case this cycle, then it suggests that the Bitcoin bull run is far from over.
Don’t Worry About The Bears
After the Golden Cross pattern appeared, another concerning development had taken place on the Bitcoin price chart and that is a bearish divergence on the weekly timeframe. Normally, this means an end to the rally and that the price could start to plummet. However, the crypto analyst seems unfazed by this.
He refers to a similar bearish divergence appearing when the Bitcoin price was trading at $80,000 and nothing happened. Since the cryptocurrency had continued its bullish run at that point, the analyst takes this as a hint that the bearish divergence is lagging and only appeared due to Donald Trump’s tariff announcement last week. “No actionable value here,” Doctor Profit said.
Things To Watch Out For
So far, Doctor Profit attributes the drawdown in the Bitcoin price to “standard cycle behavior.” This includes profit-taking from short-term holders who bought in the last six months, while long-term holders remain unmoved. Another bullish factor includes the fact that BlackRock’s outflows remain low despite Trump’s renewed tariff war.
Formations on the Bitcoin price chart that show bullish tendencies include a Cup and Handle pattern on the daily chart that puts the breakout zone between $113,000 and $115,000. Also, the Bitcoin price has been recording higher highs and higher lows after recording its bottom at $74,000, which shows trend support remains strong.
The Bitcoin price is also trading above all major moving averages (MAs), including the 20-day, 50-day, and 200-day moving averages. Last but not least, Doctor Profit also pointed out that the MACD line has crossed above the signal line on the weekly chart. This means that momentum remains in favor of the bulls. Given this, the analyst believes “there is no reason to be scared at all.”
