

Bitcoin has once again broken higher, pushing through key resistance zones and extending its bullish momentum.
After multiple attempts to reclaim the previous all-time highs, the market has finally shifted gears, with bulls regaining control amid a backdrop of improving sentiment and a strong technical structure. Now, the main question is how far can BTC reach?
Technical Analysis
The Daily Chart
On the daily timeframe, the breakout has been clean and convincing. The price surged through the $100K resistance zone, followed by a swift rally toward the $110K mark. The bullish structure remains intact, with the 100-day and 200-day moving averages providing strong dynamic support at $90K and $92K, respectively.
The RSI is currently hovering in the overbought region, which may hint at short-term cooling but does not yet show divergence. Overall, as long as BTC holds above the $108K level, the path of least resistance remains to the upside.
The 4-Hour Chart
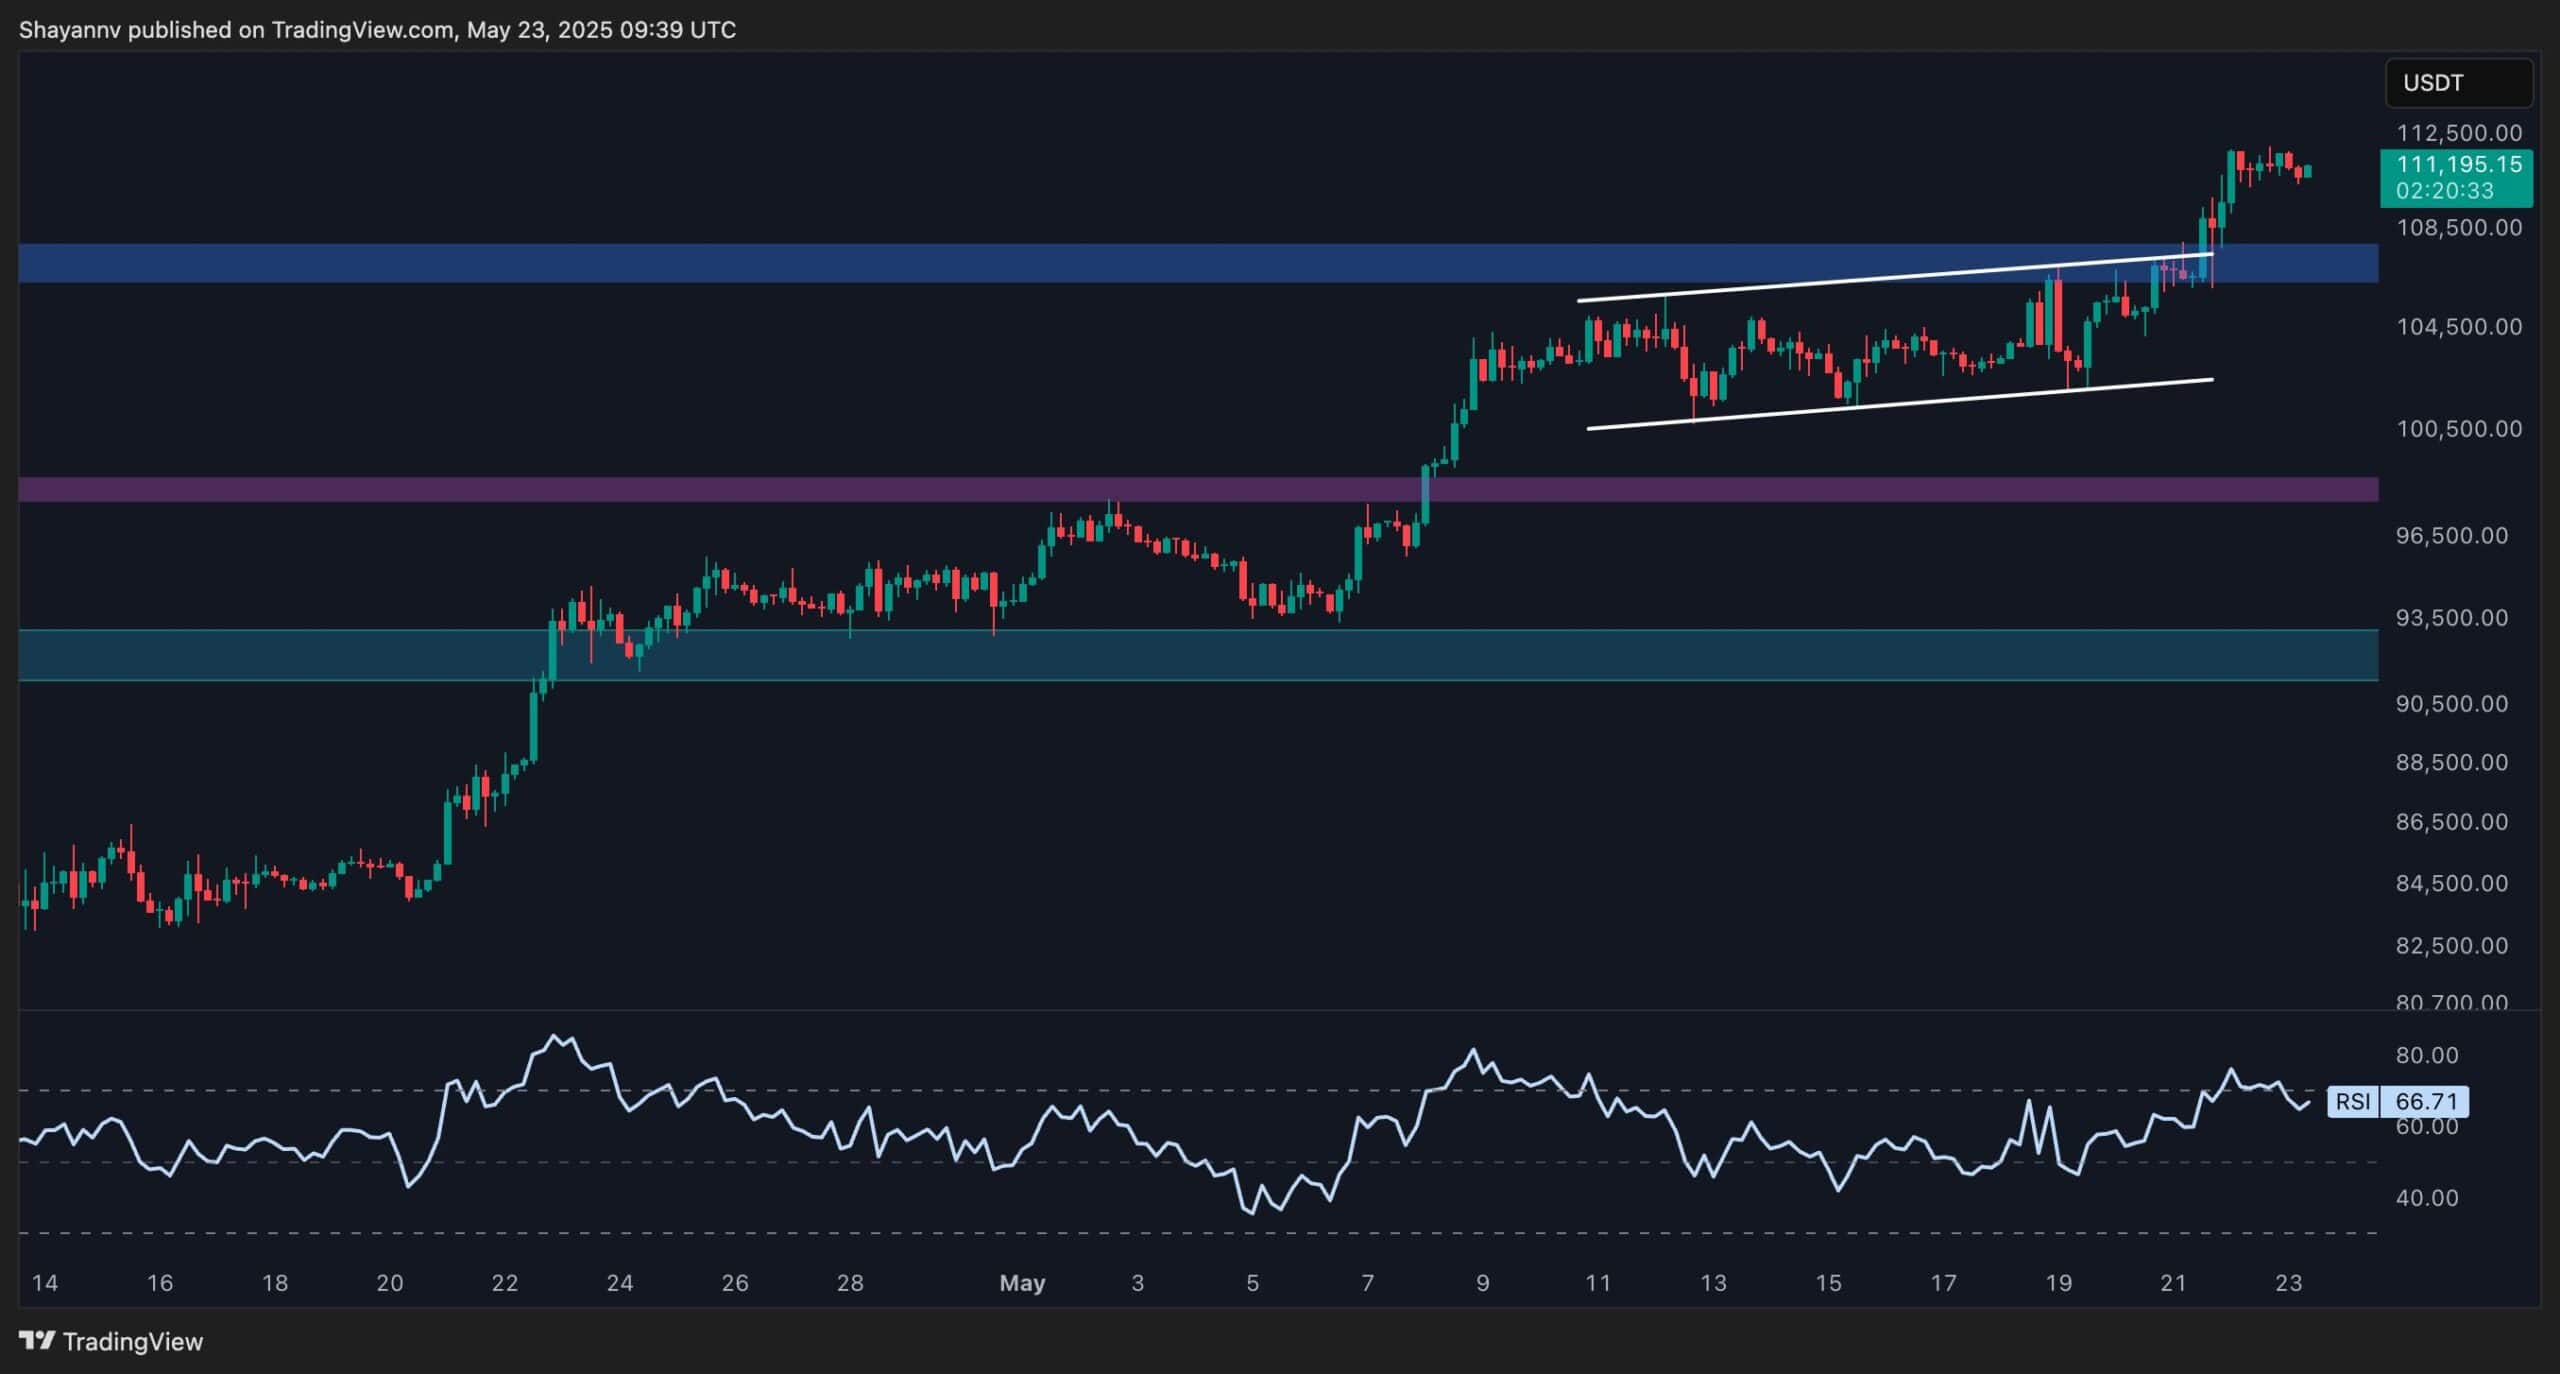
The 4-hour chart reveals a rising channel structure that guided the price into the $108K all-time high region. After a textbook breakout from the consolidation, BTC surged through the upper boundary of the rising channel with strong momentum.
The price has now stabilized around the $108K zone, which should now act as short-term support. With the RSI trending around 66, showing some relief from earlier overbought levels, the buyers still have room to push higher. For now, the $115K psychological resistance level is the immediate area to watch, while $108K becomes the key level that bulls must defend to avoid a deeper correction.
Sentiment Analysis
Active Addresses (100-day Moving Average)
On-chain data adds more confidence to the ongoing uptrend. The number of active addresses has started to tick higher after months of decline, indicating a rebound in network activity. This uptick could be signaling renewed retail and institutional interest, often a precursor to sustained bullish momentum. Though still below the early 2024 highs in activity, the change in direction is encouraging and aligns with the current price trend.
With strong price action across multiple timeframes and a resurgence in active addresses, Bitcoin appears well-positioned to continue its rally. However, with RSI extended on higher timeframes, short-term pullbacks remain possible. As long as the structure above $108K holds, any dip could be seen as a buying opportunity before the next leg higher.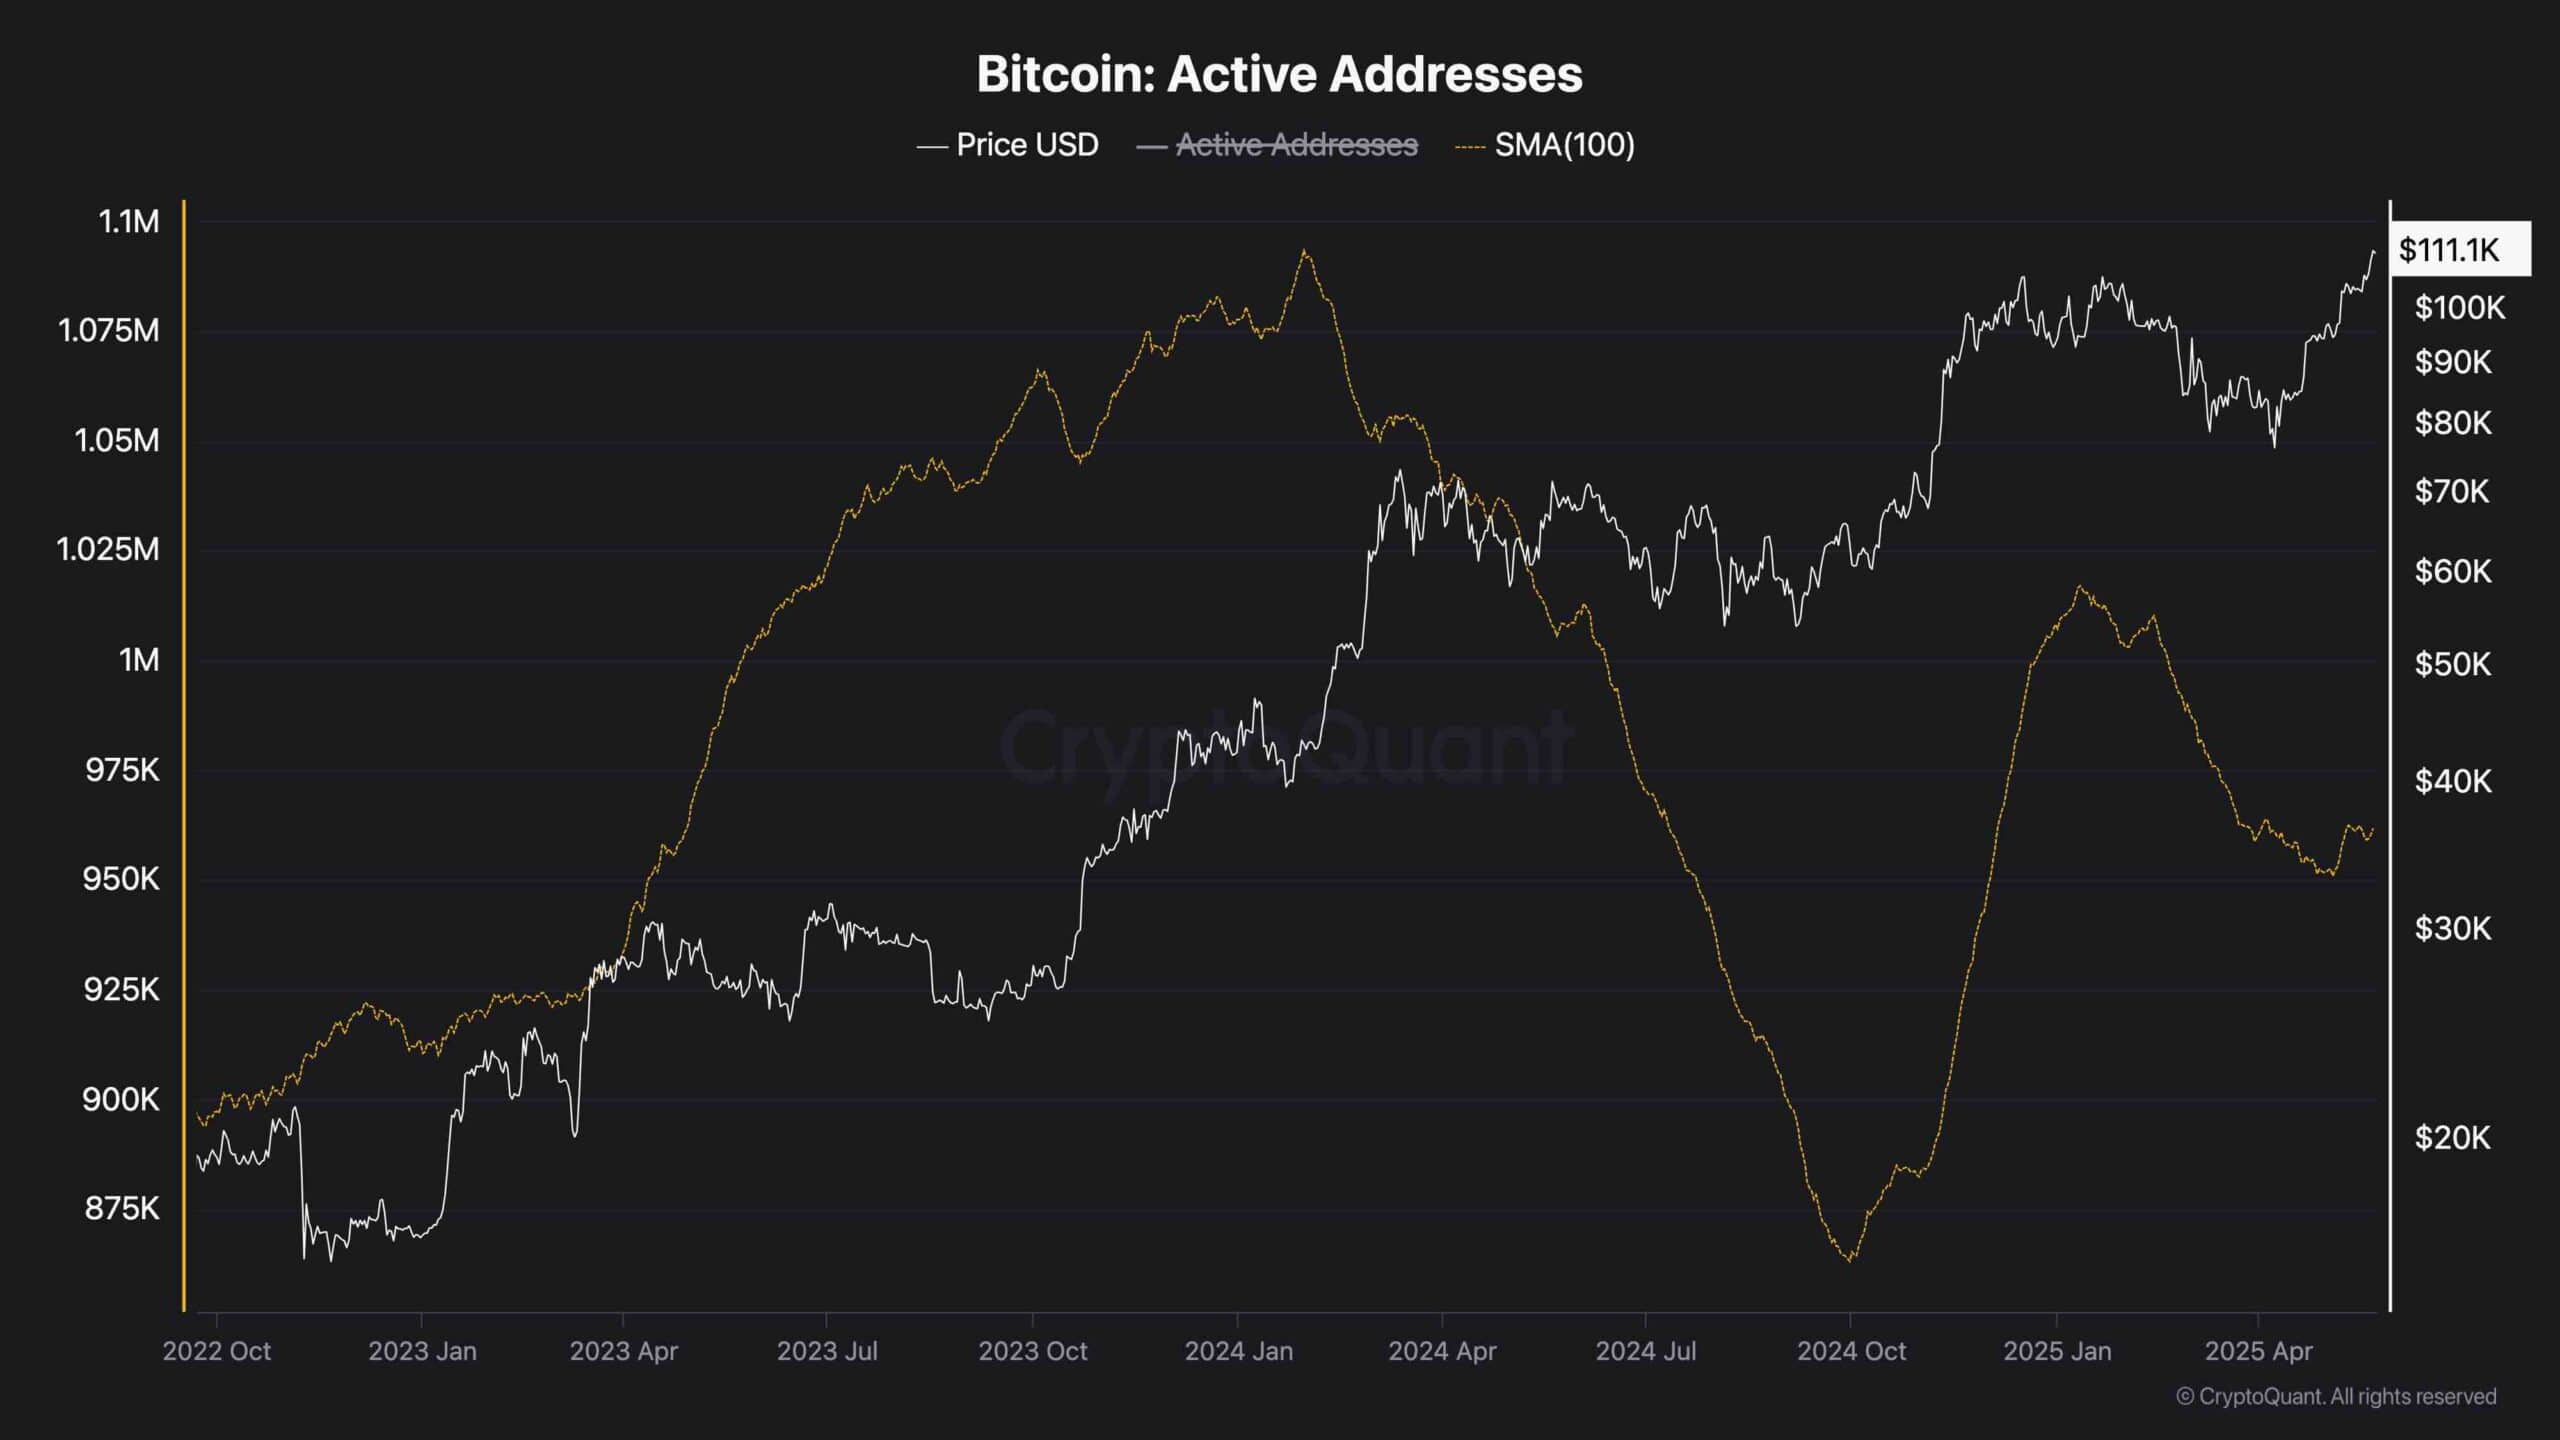
The post Bitcoin Price Analysis: Is a Short-Term Pullback Inevitable After Recent Surge? appeared first on CryptoPotato.
