

After a powerful rally earlier this month, Bitcoin’s price action has stalled just above $103,000 and has been caught in a tight consolidation range for over the past week. The daily chart shows consistent resistance just above $107,000, with the latest candles forming in a compressed horizontal band, indicating indecision and low momentum.
This price behavior could be seen as a pause before the next leg higher. However, it could also be a trap that could cause a reversal towards $98,000.
Daily Close Above $107K A Clear Breakout Signal
Bitcoin’s current consolidation around the $103,000 price level has dragged on for over a week, and an eventual breakout could happen into any direction. In a recent post on social media platform X, crypto analyst Ali Martinez noted the importance of a daily close above $107,000 for a bullish Bitcoin.
His chart illustrates that price has approached this threshold multiple times since December 2024 but failed to sustain a close on the daily timeframe. This, in turn, has led to the formation of a horizontal barrier just beneath $108,000. Notably, even Bitcoin’s all-time high of $108,786 on January 20 failed to close above the $107,000 price level on that day.
According to Martinez, a confirmed close above this level could open the door for further upside movement toward new all-time highs. However, until this threshold is decisively cleared, Martinez warns that traders should be cautious and avoid forcing positions.
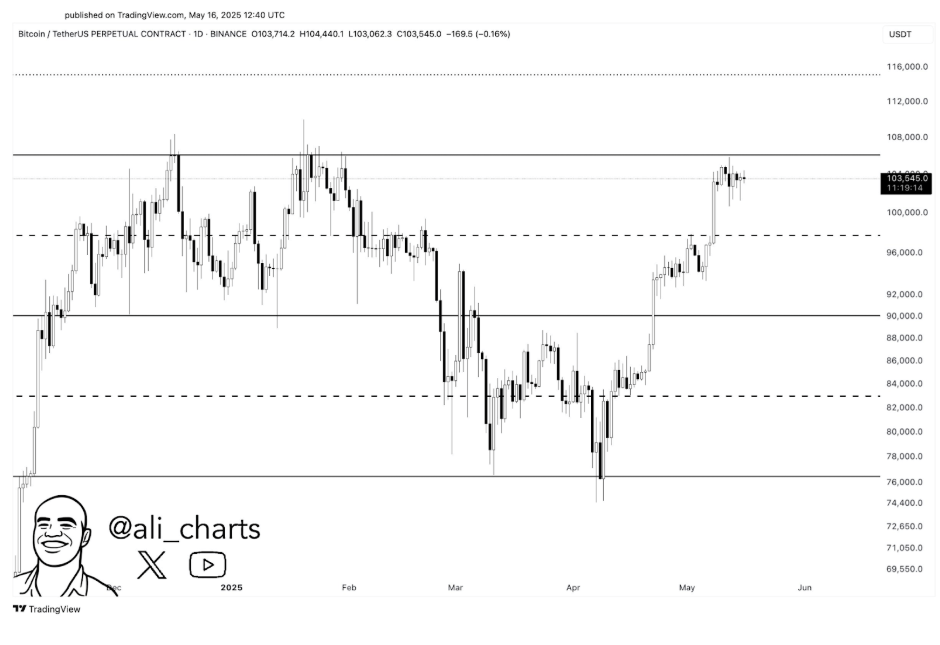
Image From X: @ali_charts
Potential Bitcoin Trap Setup And Liquidity Sweep To $98K
A separate technical breakdown by crypto analyst TehThomas, published on TradingView, presents a far more cautious outlook for Bitcoin. Similarly, the analyst noted that Bitcoin has spent more than eight days locked in a narrow range between roughly $100,000 and $105,800.
According to his liquidity-based framework, this range is likely being used as a trap to invite both long and short traders into premature breakout trades. His 4-hour candlestick timeframe chart shows a clear consolidation block, with price failing to escape either end, and liquidity pooling above $105,800 as well as under $100,000.
TehThomas believes the equal highs near $105,800 are acting as bait for breakout longs. He expects Bitcoin to briefly sweep these highs, only to cause a fast and decisive move downwards into the lower demand zone between $98,000 and $97,500.
This zone, marked as a large unmitigated fair value gap and golden pocket level on his chart, is where he expects the price to react next, once the liquidity on both sides is taken.
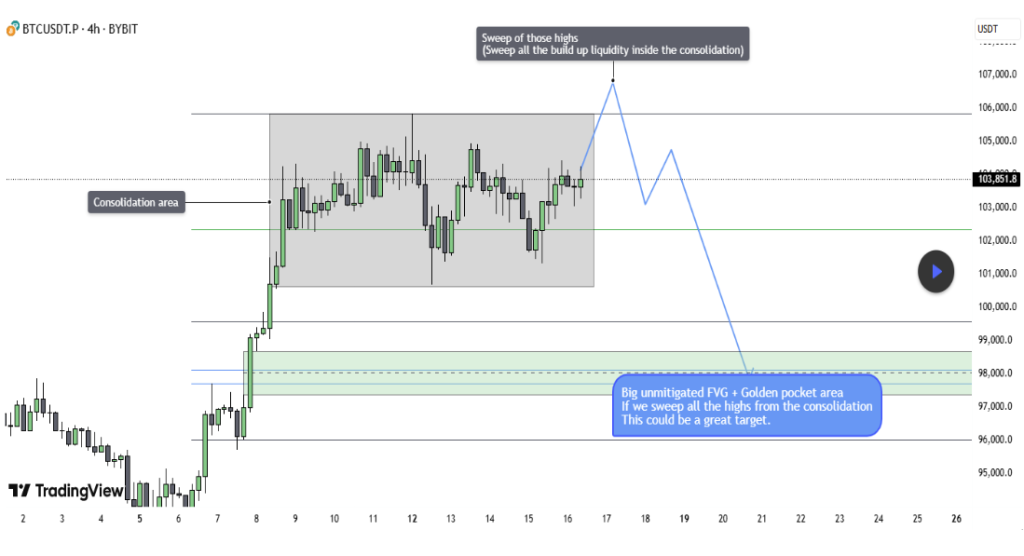
Image From TradingView: TehThomas
However, this short setup towards $98,000 would be invalidated if the Bitcoin price manages to hold above $105,800 and shows a continued strong volume and follow-through.
At the time of writing, Bitcoin was trading at $103,914, down by 0.06% in the past 24 hours.
Featured image from Unsplash, chart from TradingView
