

Ethereum remains range-bound between the 100-day and 200-day moving averages, signalling a consolidation phase.
However, a decisive breakout in either direction will likely define the next major trend, with market sentiment leaning toward a potential bullish breakout in the coming days.
ETH Price Analysis: Technicals
By Shayan
The Daily Chart
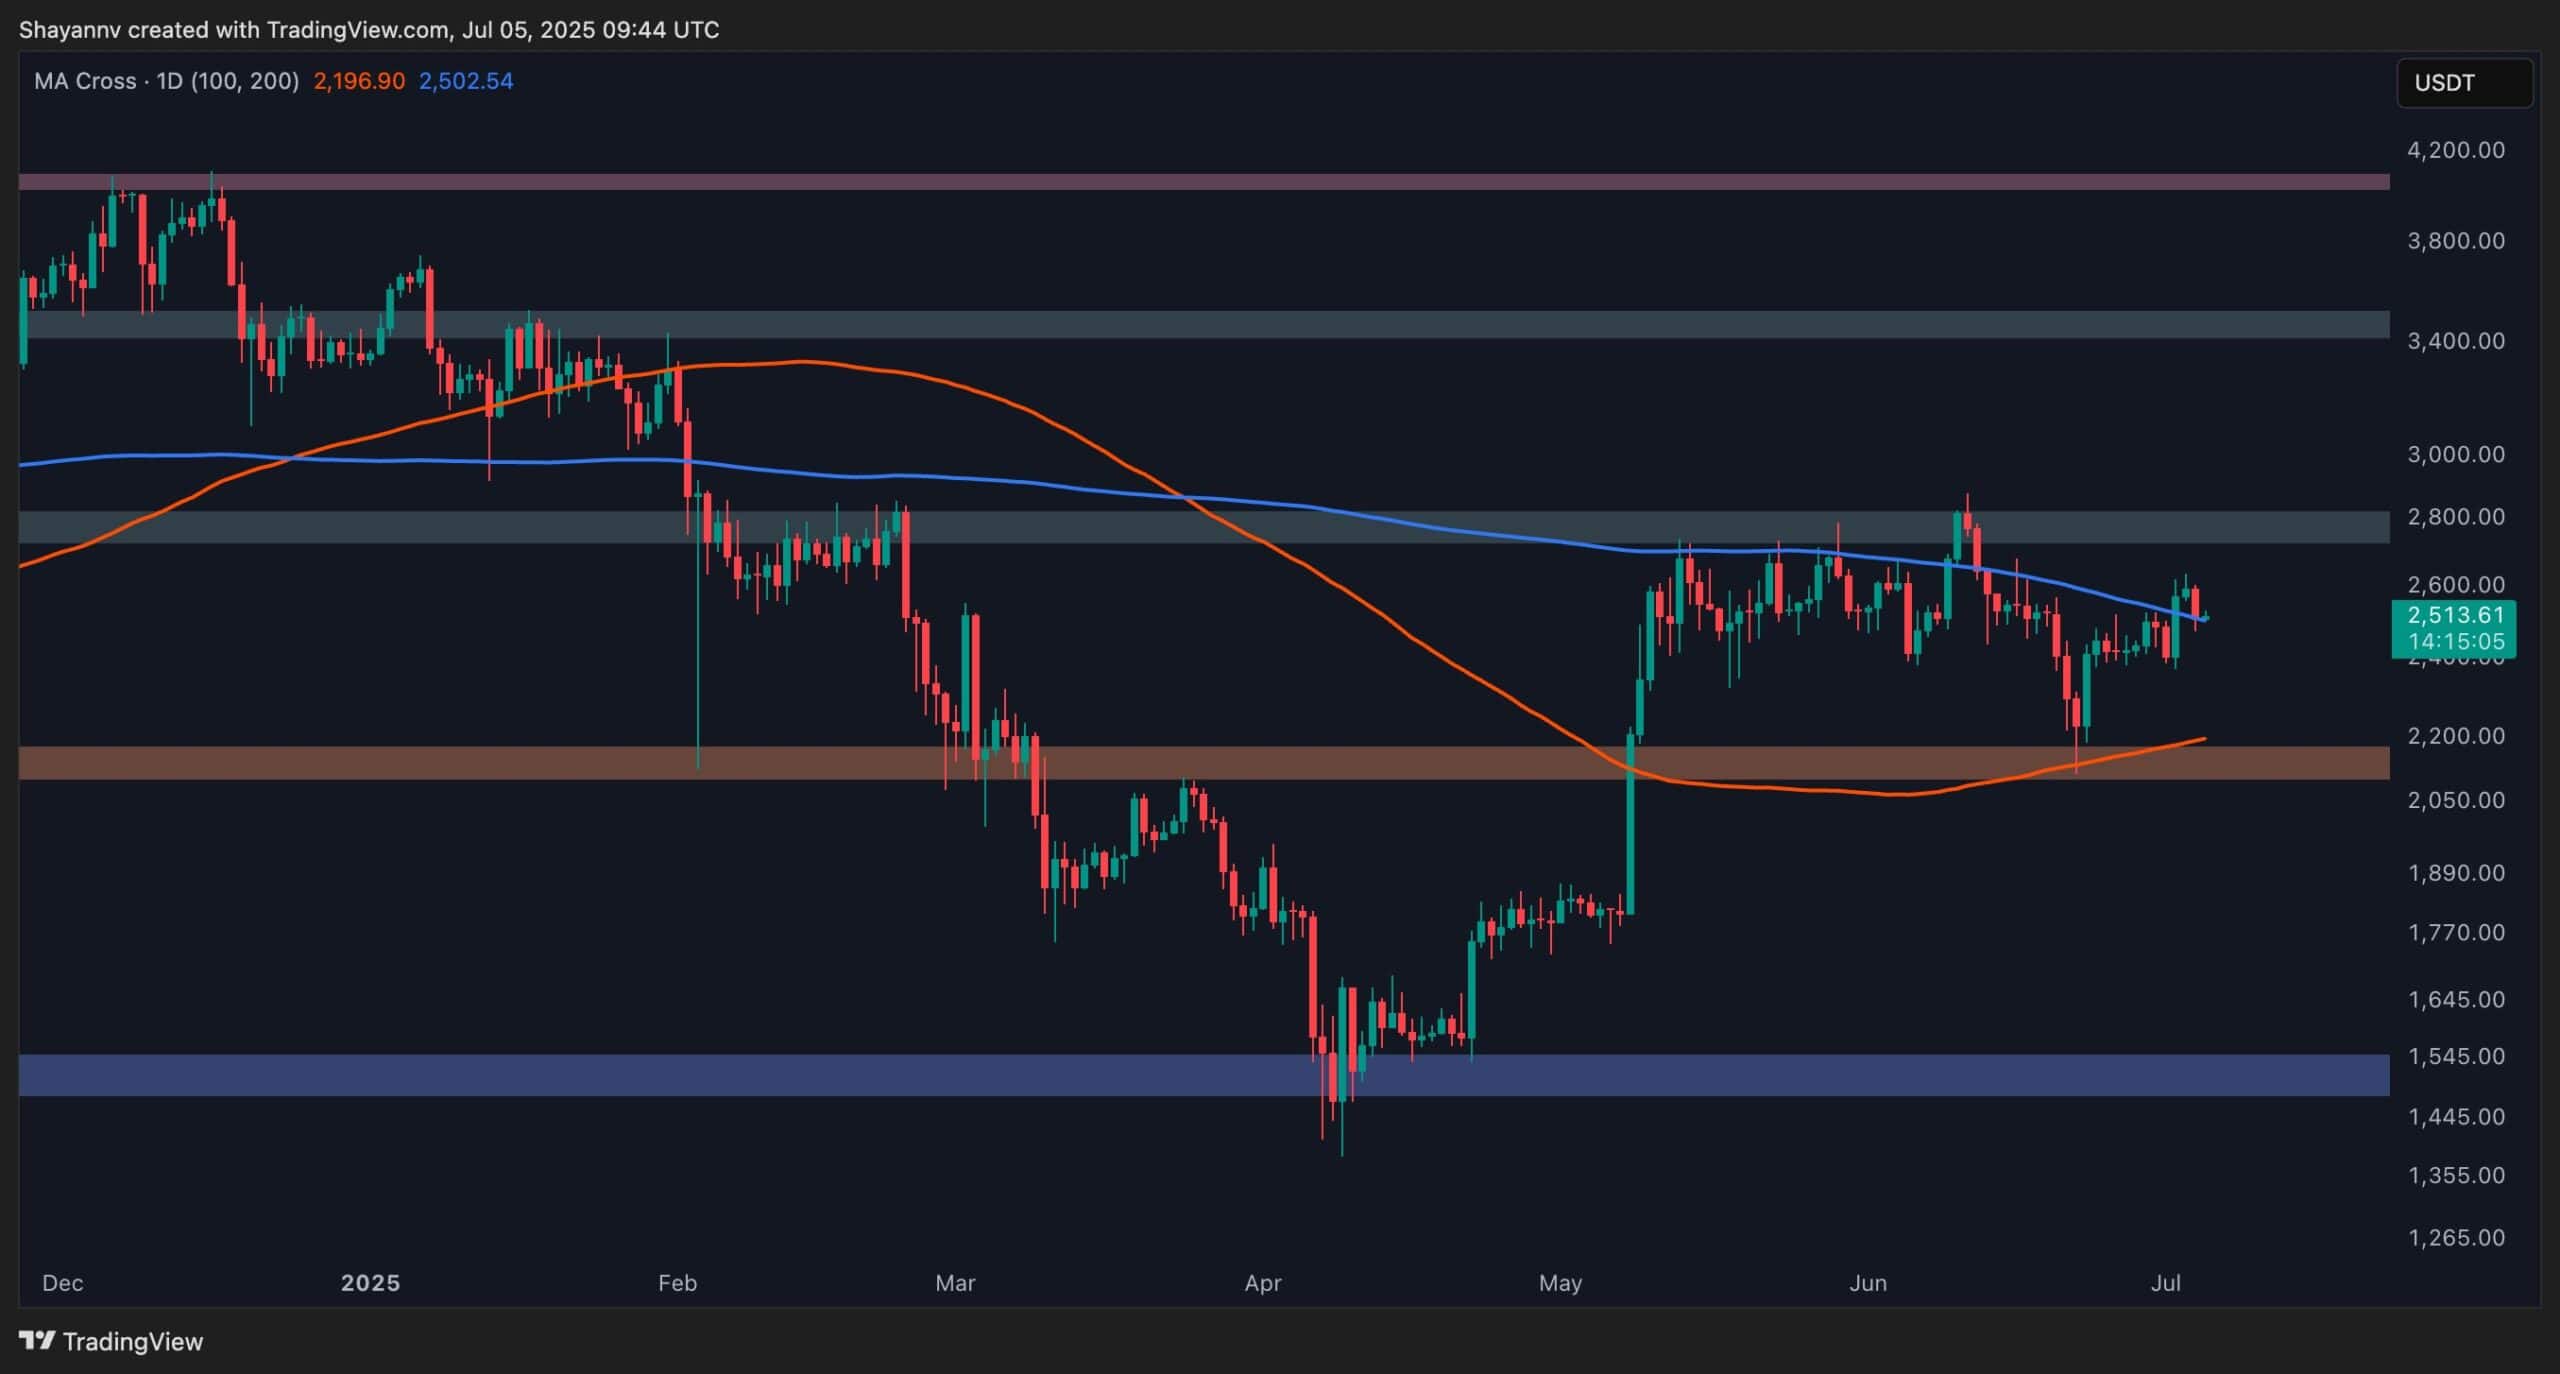
ETH is currently consolidating between the 100-day and 200-day moving averages, entering a decisive phase in its price action.
After breaking above the pivotal 200-day MA around $2.5K, an area that has acted as strong resistance in recent weeks, the price has pulled back to retest this level. This pullback is crucial: if bullish demand resurfaces and holds ETH above this moving average, it would likely ignite another leg upward, targeting the $2.8K resistance zone.
For now, the cryptocurrency appears to be range-bound between $2.5K and $2.8K, and a clear breakout from this zone will likely set the stage for the next significant trend direction. Market participants are closely watching for a bullish continuation, which could solidify ETH’s reversal structure.
The 4-Hour Chart
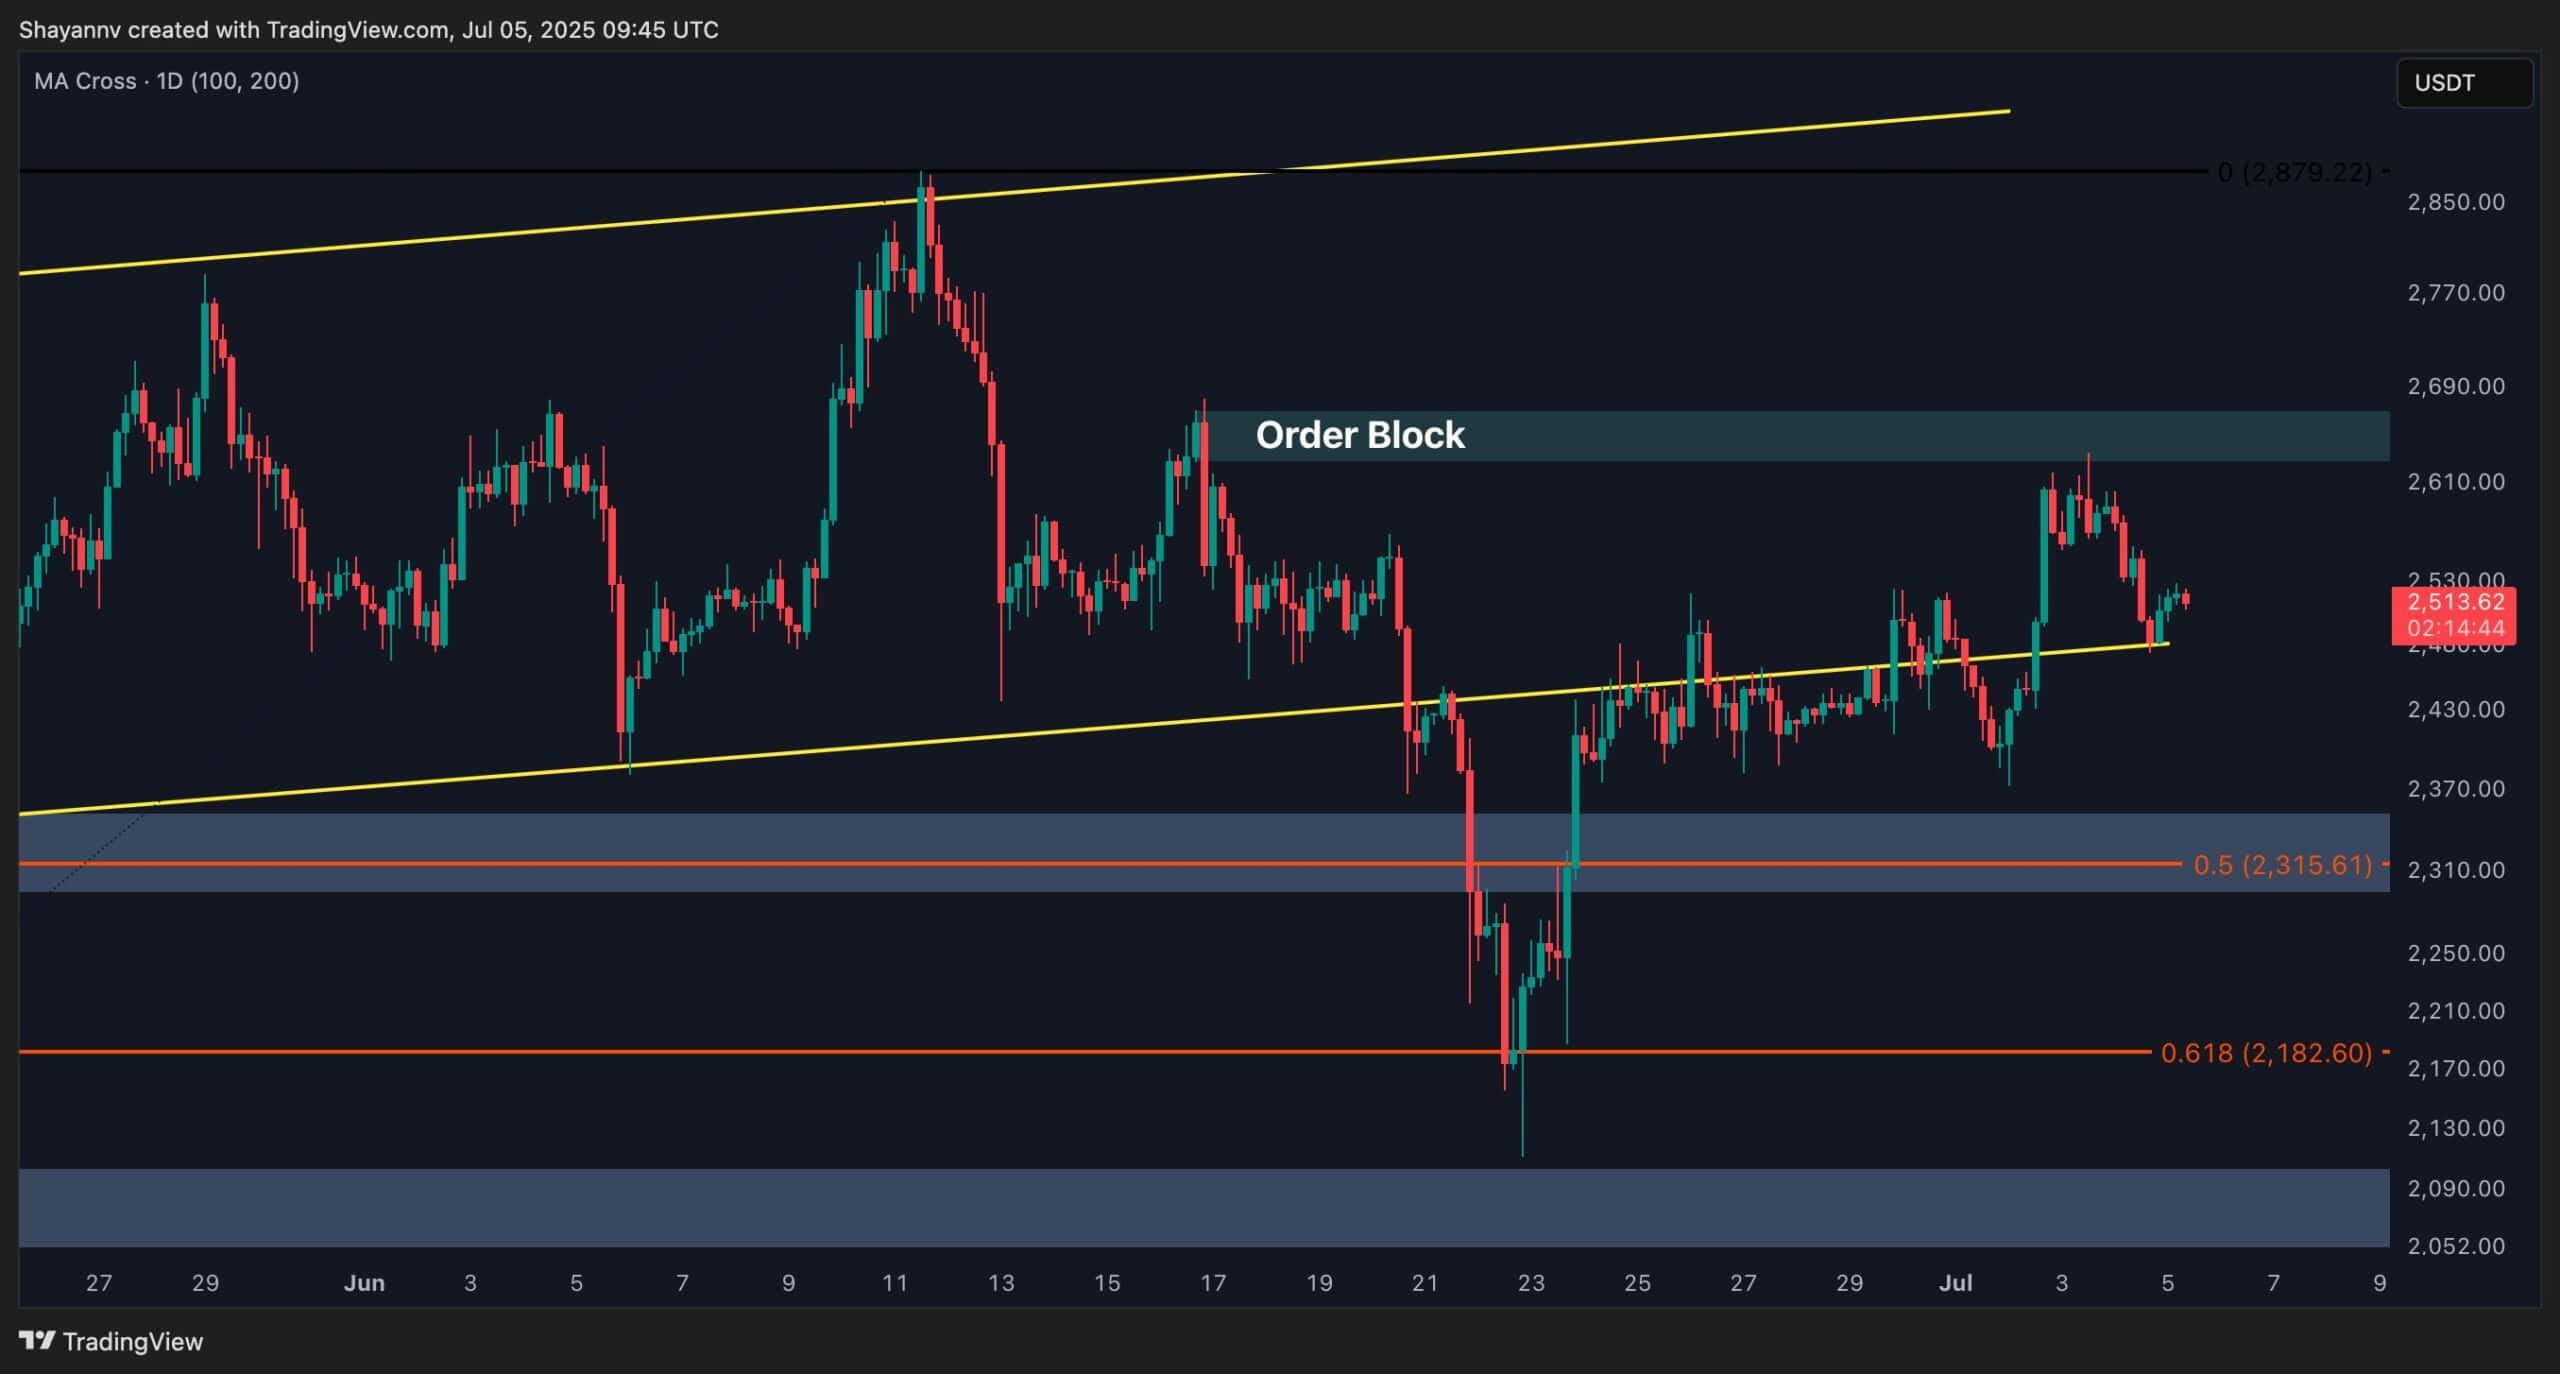
On the lower timeframe, ETH’s recent rally encountered resistance at a key bearish order block between $2625 and $2670, where sellers re-entered the market. This rejection has pushed the price back toward the $2.5K support level, a historically significant zone for ETH.
This area now serves as a crucial battleground. If buyers manage to defend it, Ethereum could regain momentum and reattempt a breakout above the overhead supply.
However, failure to hold $2.5K could trigger extended consolidation or even a retracement toward lower supports.
Onchain Analysis
By Shayan
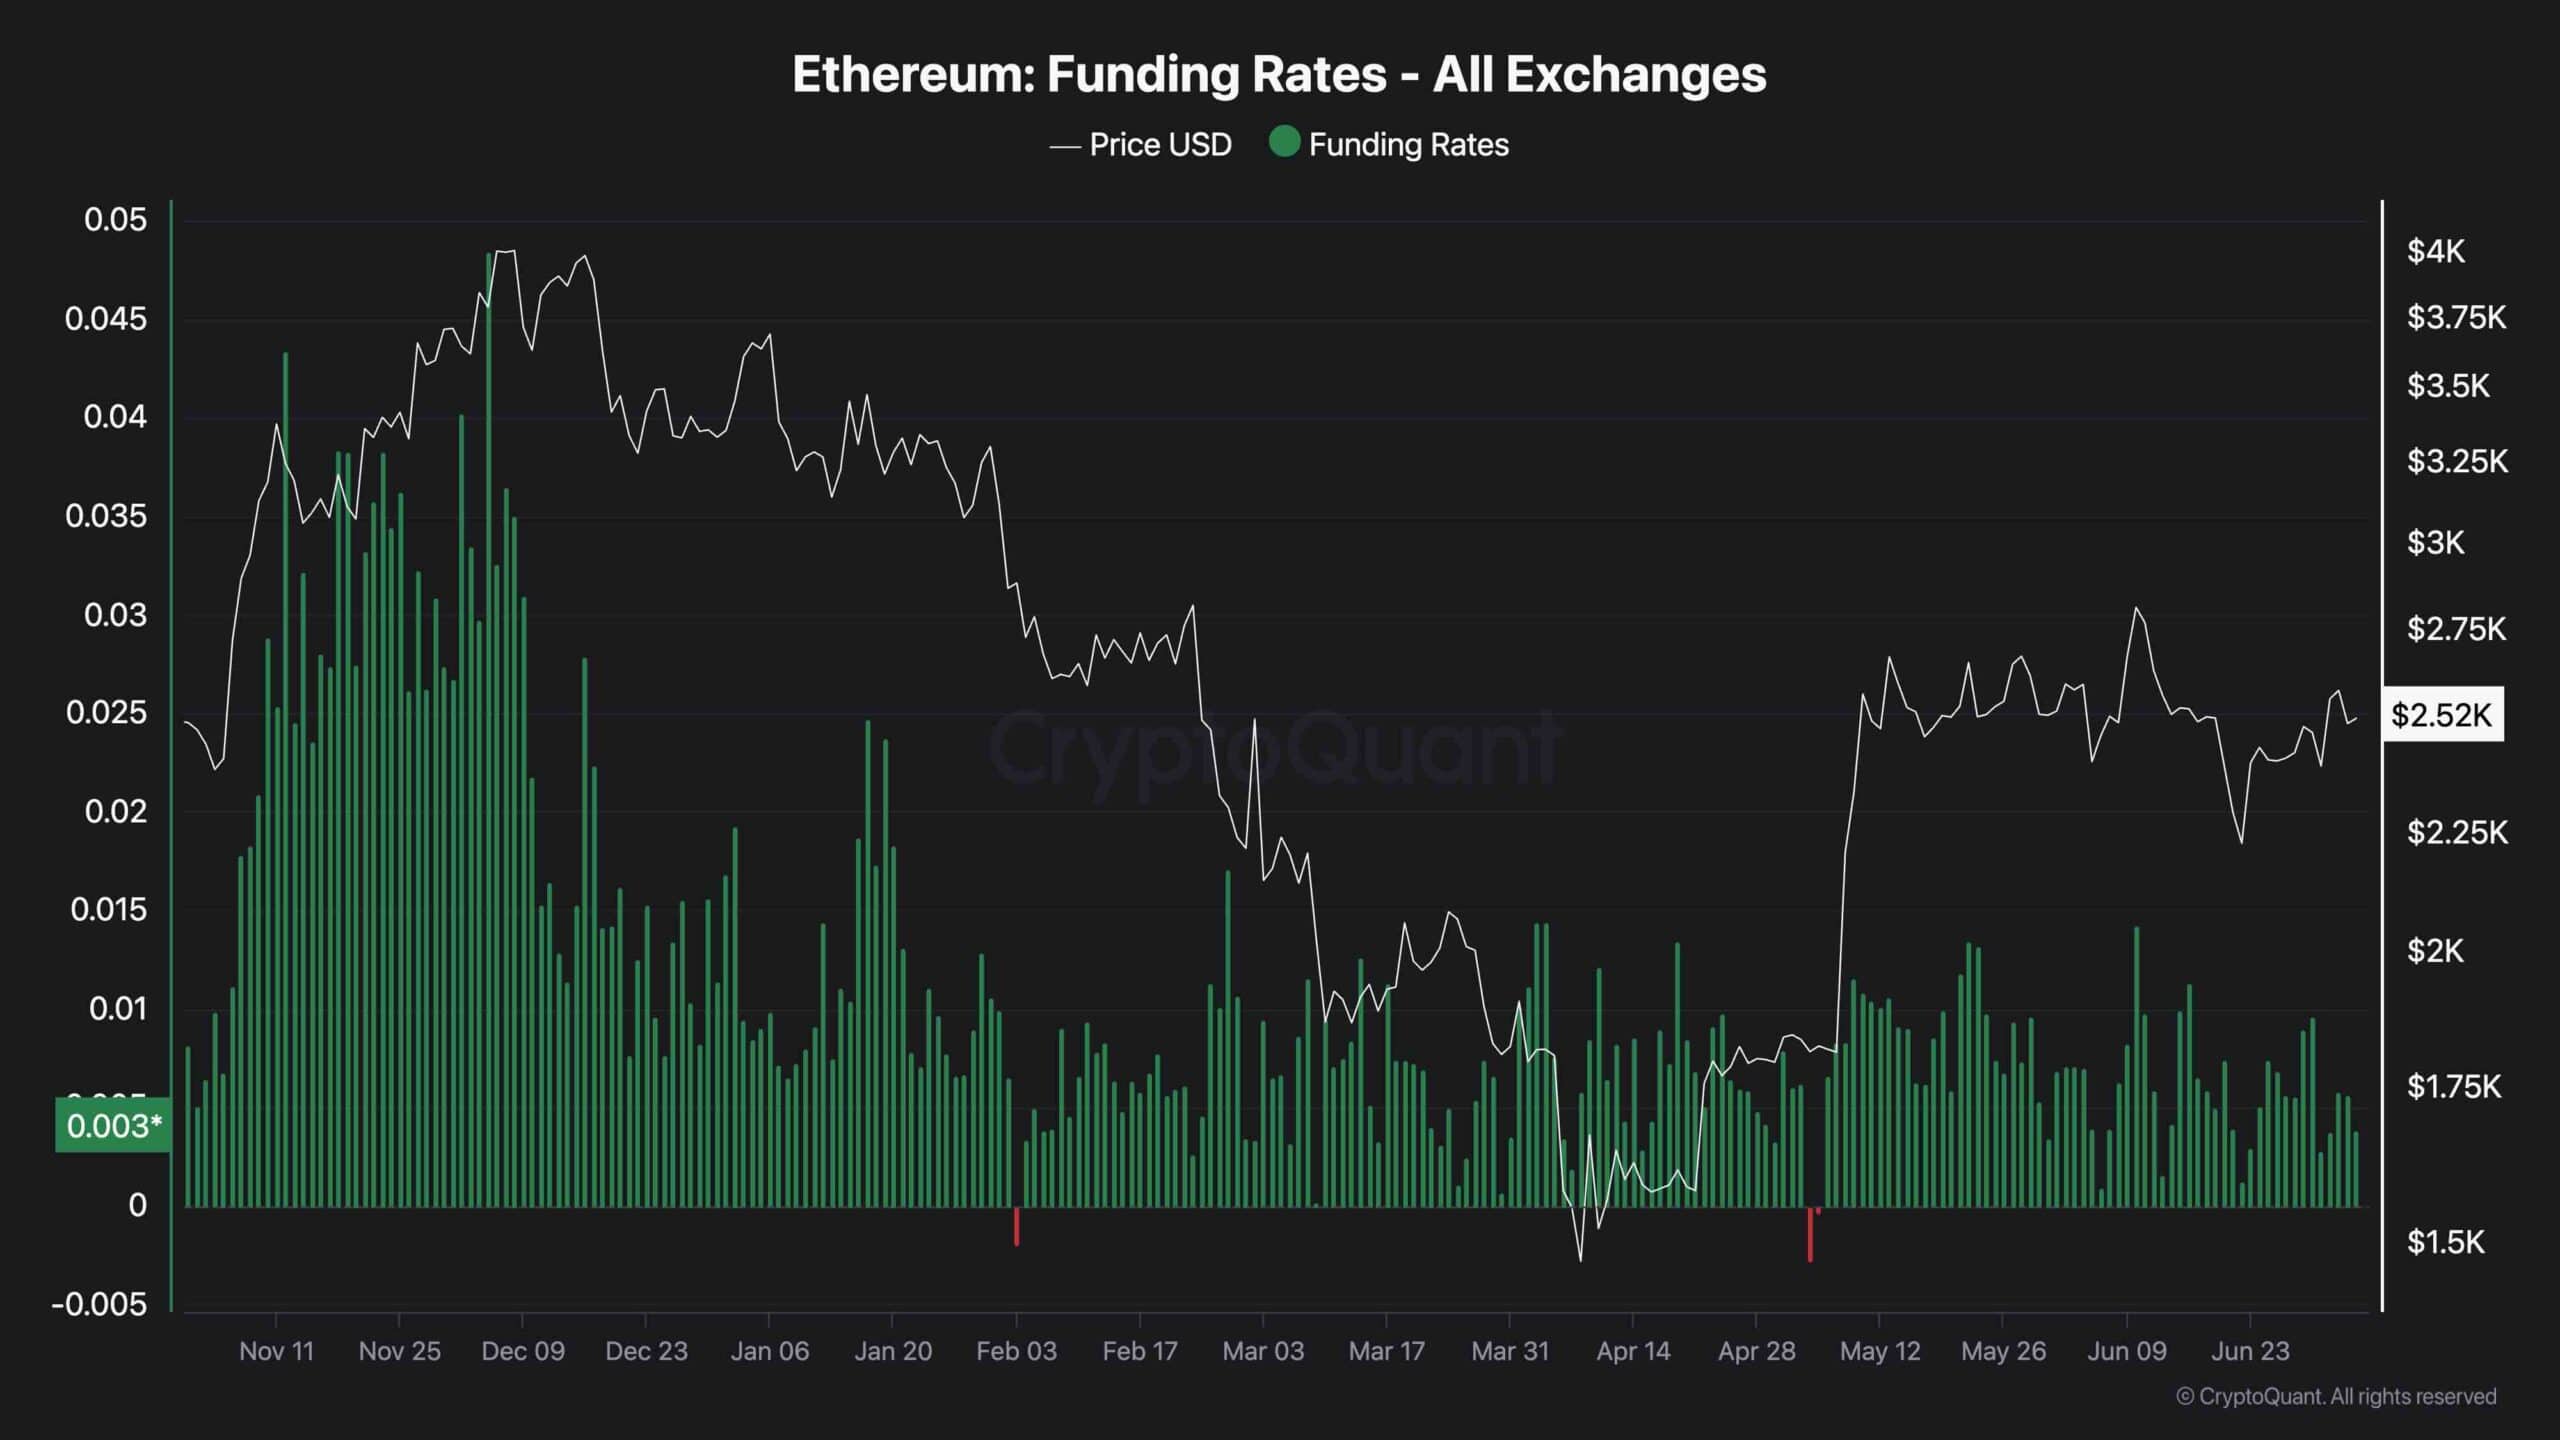
The funding rate remains a key indicator of market sentiment in Ethereum’s futures market. In a healthy uptrend, this metric typically trends upward, reflecting increasing confidence and positioning from long-biased traders in both spot and perpetual markets.
Currently, however, ETH’s funding rates have been declining amid price consolidation between the 100-day and 200-day moving averages. This suggests reduced bullish conviction and signs of buyer exhaustion, raising the likelihood of continued short-term sideways movement.
For Ethereum to break above the critical $2.6K and $2.8K resistance zones, stronger demand must flow into the derivatives market, lifting the funding rate to more positive levels. Until that shift materializes, the consolidation phase is likely to persist.
The post Ethereum Gains 4% This Week, What are the Next Targets? ETH Price Analysis appeared first on CryptoPotato.
