

Institutional demand for Ethereum appears strong as spot exchange-traded funds (ETFs) have recorded seventh-straight week of inflows.
US Ethereum Spot ETFs Have Recently Seen Continuous Inflows
In a new post on X, the analytics firm Glassnode has shared an update on how the netflow related to the US Ethereum spot ETFs is looking. Spot ETFs are investment vehicles that allow investors to gain exposure to a given cryptocurrency without having to directly own tokens of it.
These ETFs trade on traditional platforms, so traders taking this route don’t have to bother with digital asset exchanges and wallets. For investors only familiar with the traditional mode, this fact can make the ETFs the preferrable mode of investment.
The US Securities and Exchange Commission (SEC) approved spot ETFs for Ethereum in mid 2024, half a year after Bitcoin’s approval went through near the start of the year.
Below is the chart shared by Glassnode that shows how the aggregate netflow has been like for the US ETH spot ETFs during the past few months.
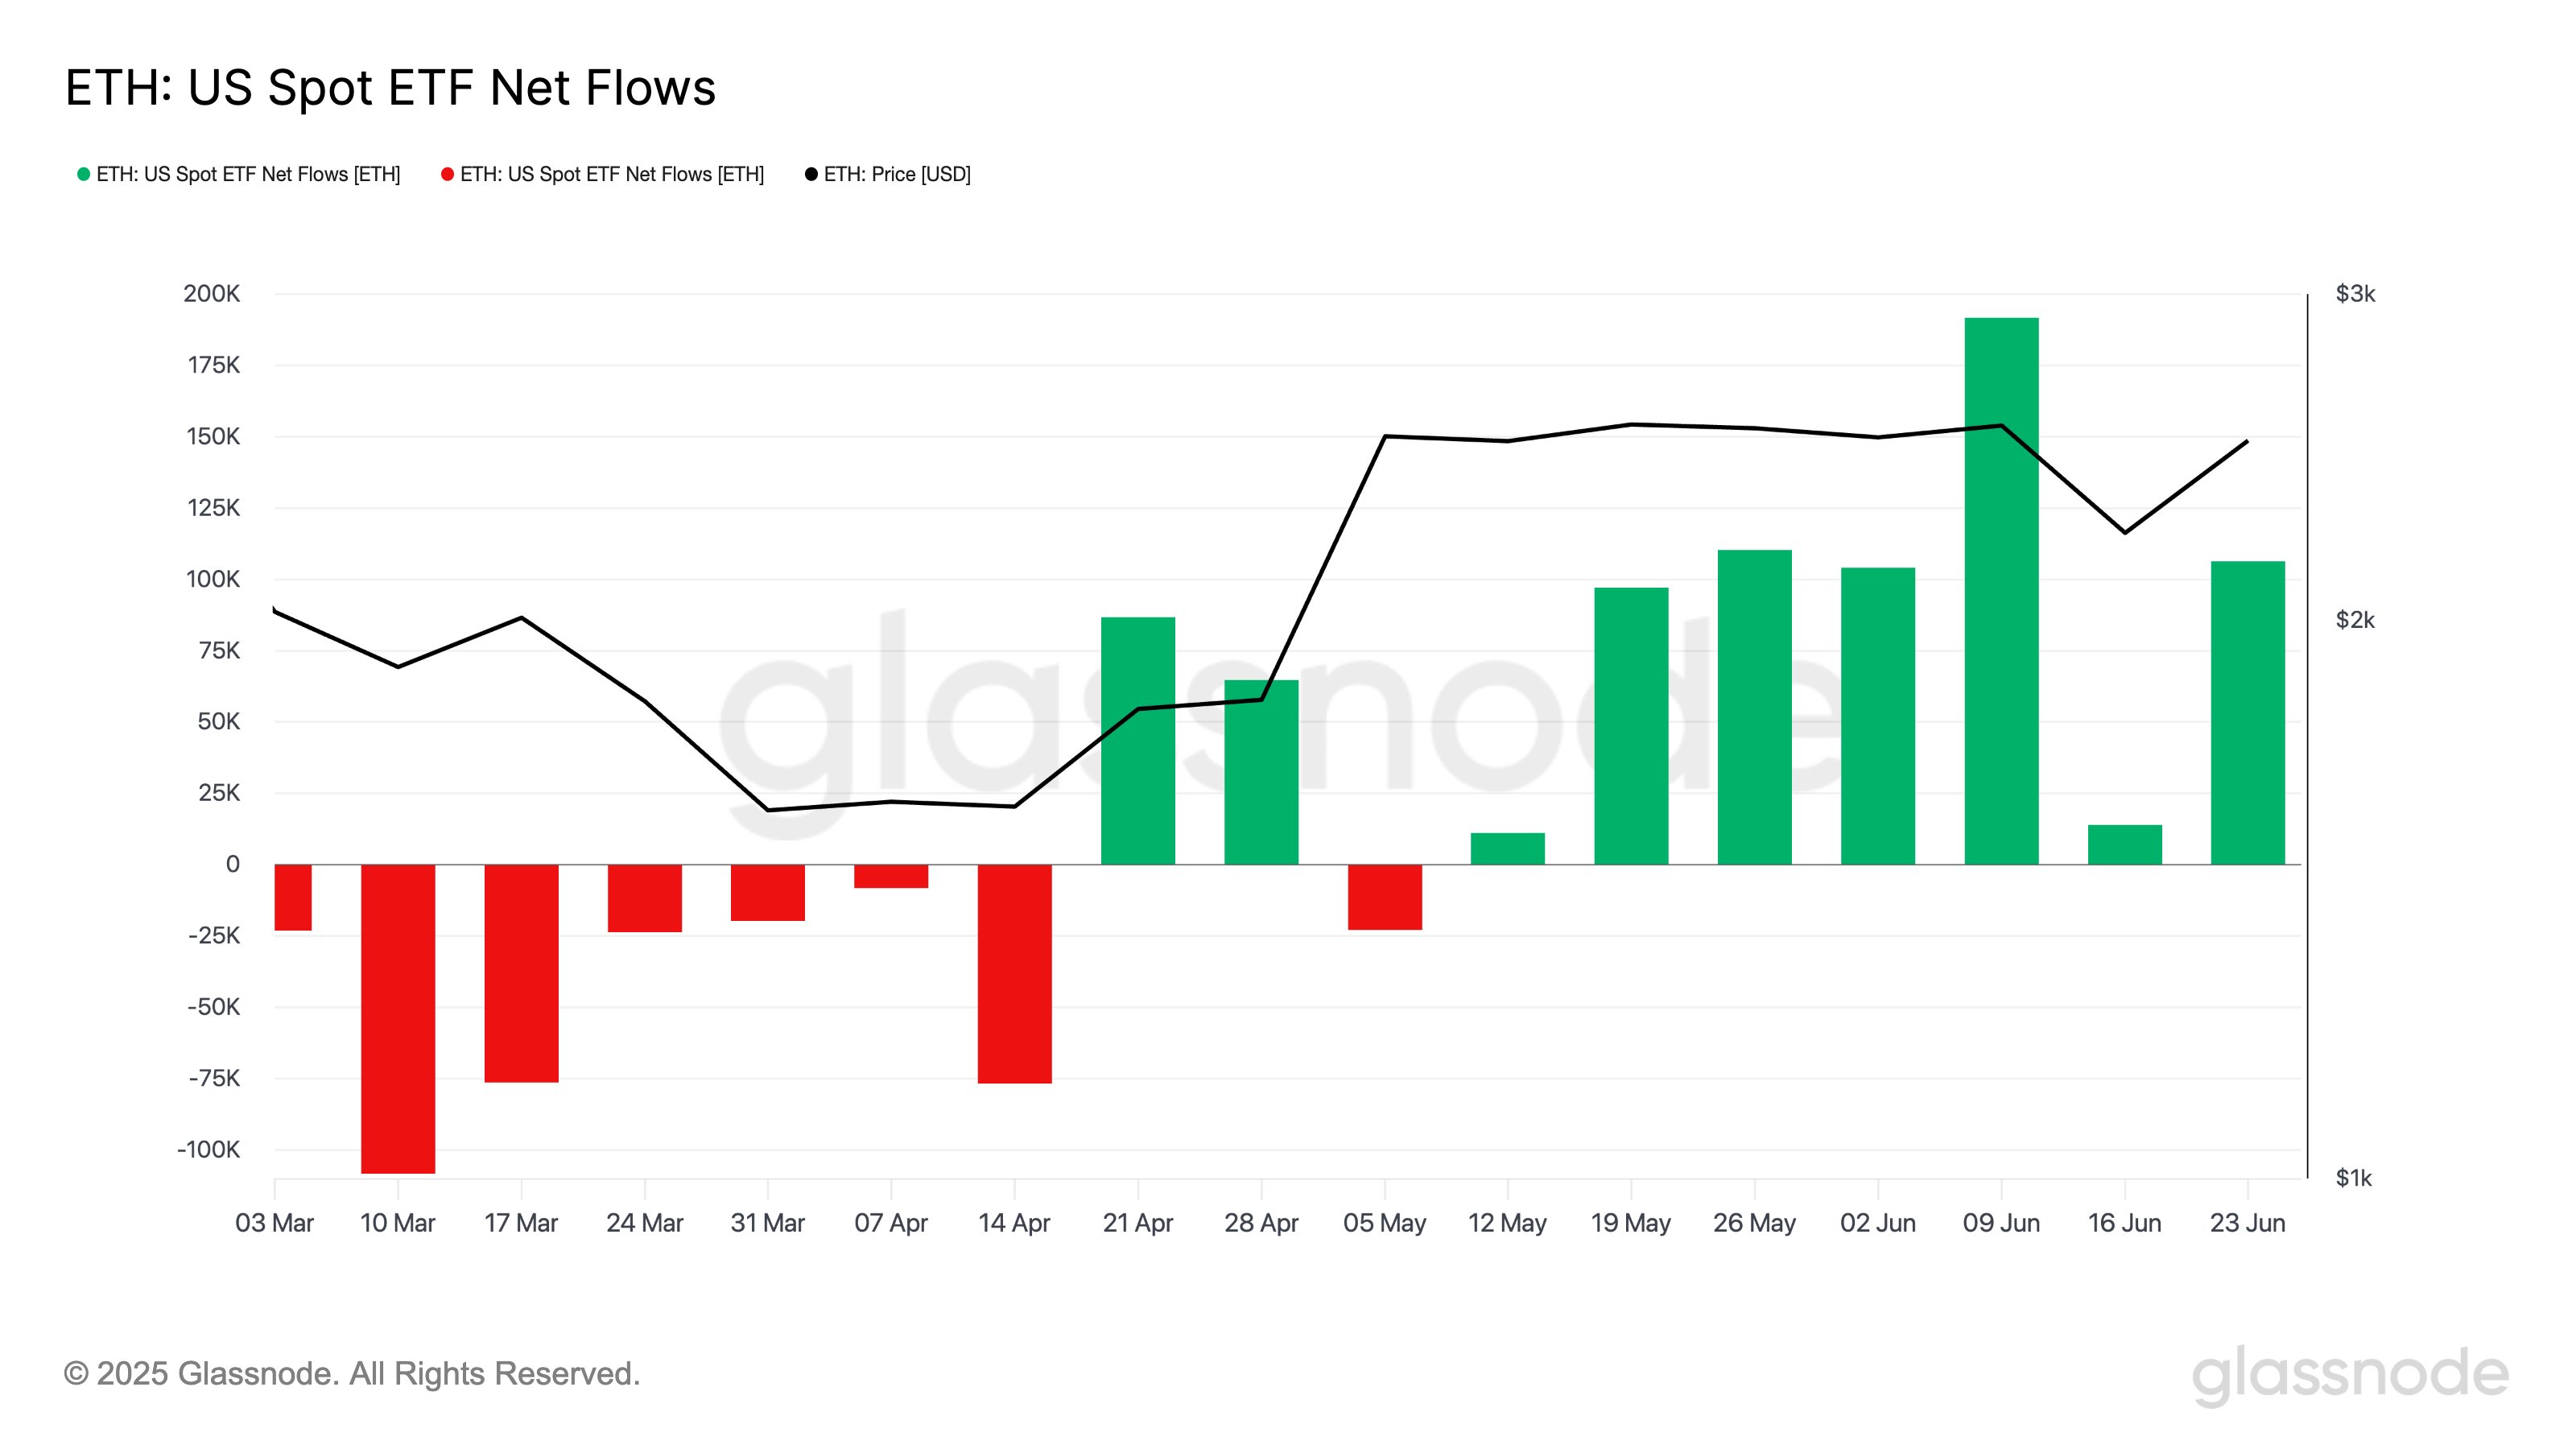
As is visible in the graph, the Ethereum spot ETFs saw outflows earlier in the year, but the trend has been different since the final third of April. Save for a week in May, a net amount of capital has been pouring into these investment vehicles.
“As ETH rebounded from $2.2K to $2.5K, institutional appetite followed,” notes Glassnode. “Spot ETH ETFs recorded 106K ETH in net inflows last week – marking the 7th consecutive week of positive flows.”
Ethereum isn’t the only cryptocurrency that has recently been enjoying ETF inflows. As the analytics firm has pointed out in another X post, the number one digital asset, Bitcoin, is also seeing demand pick up.
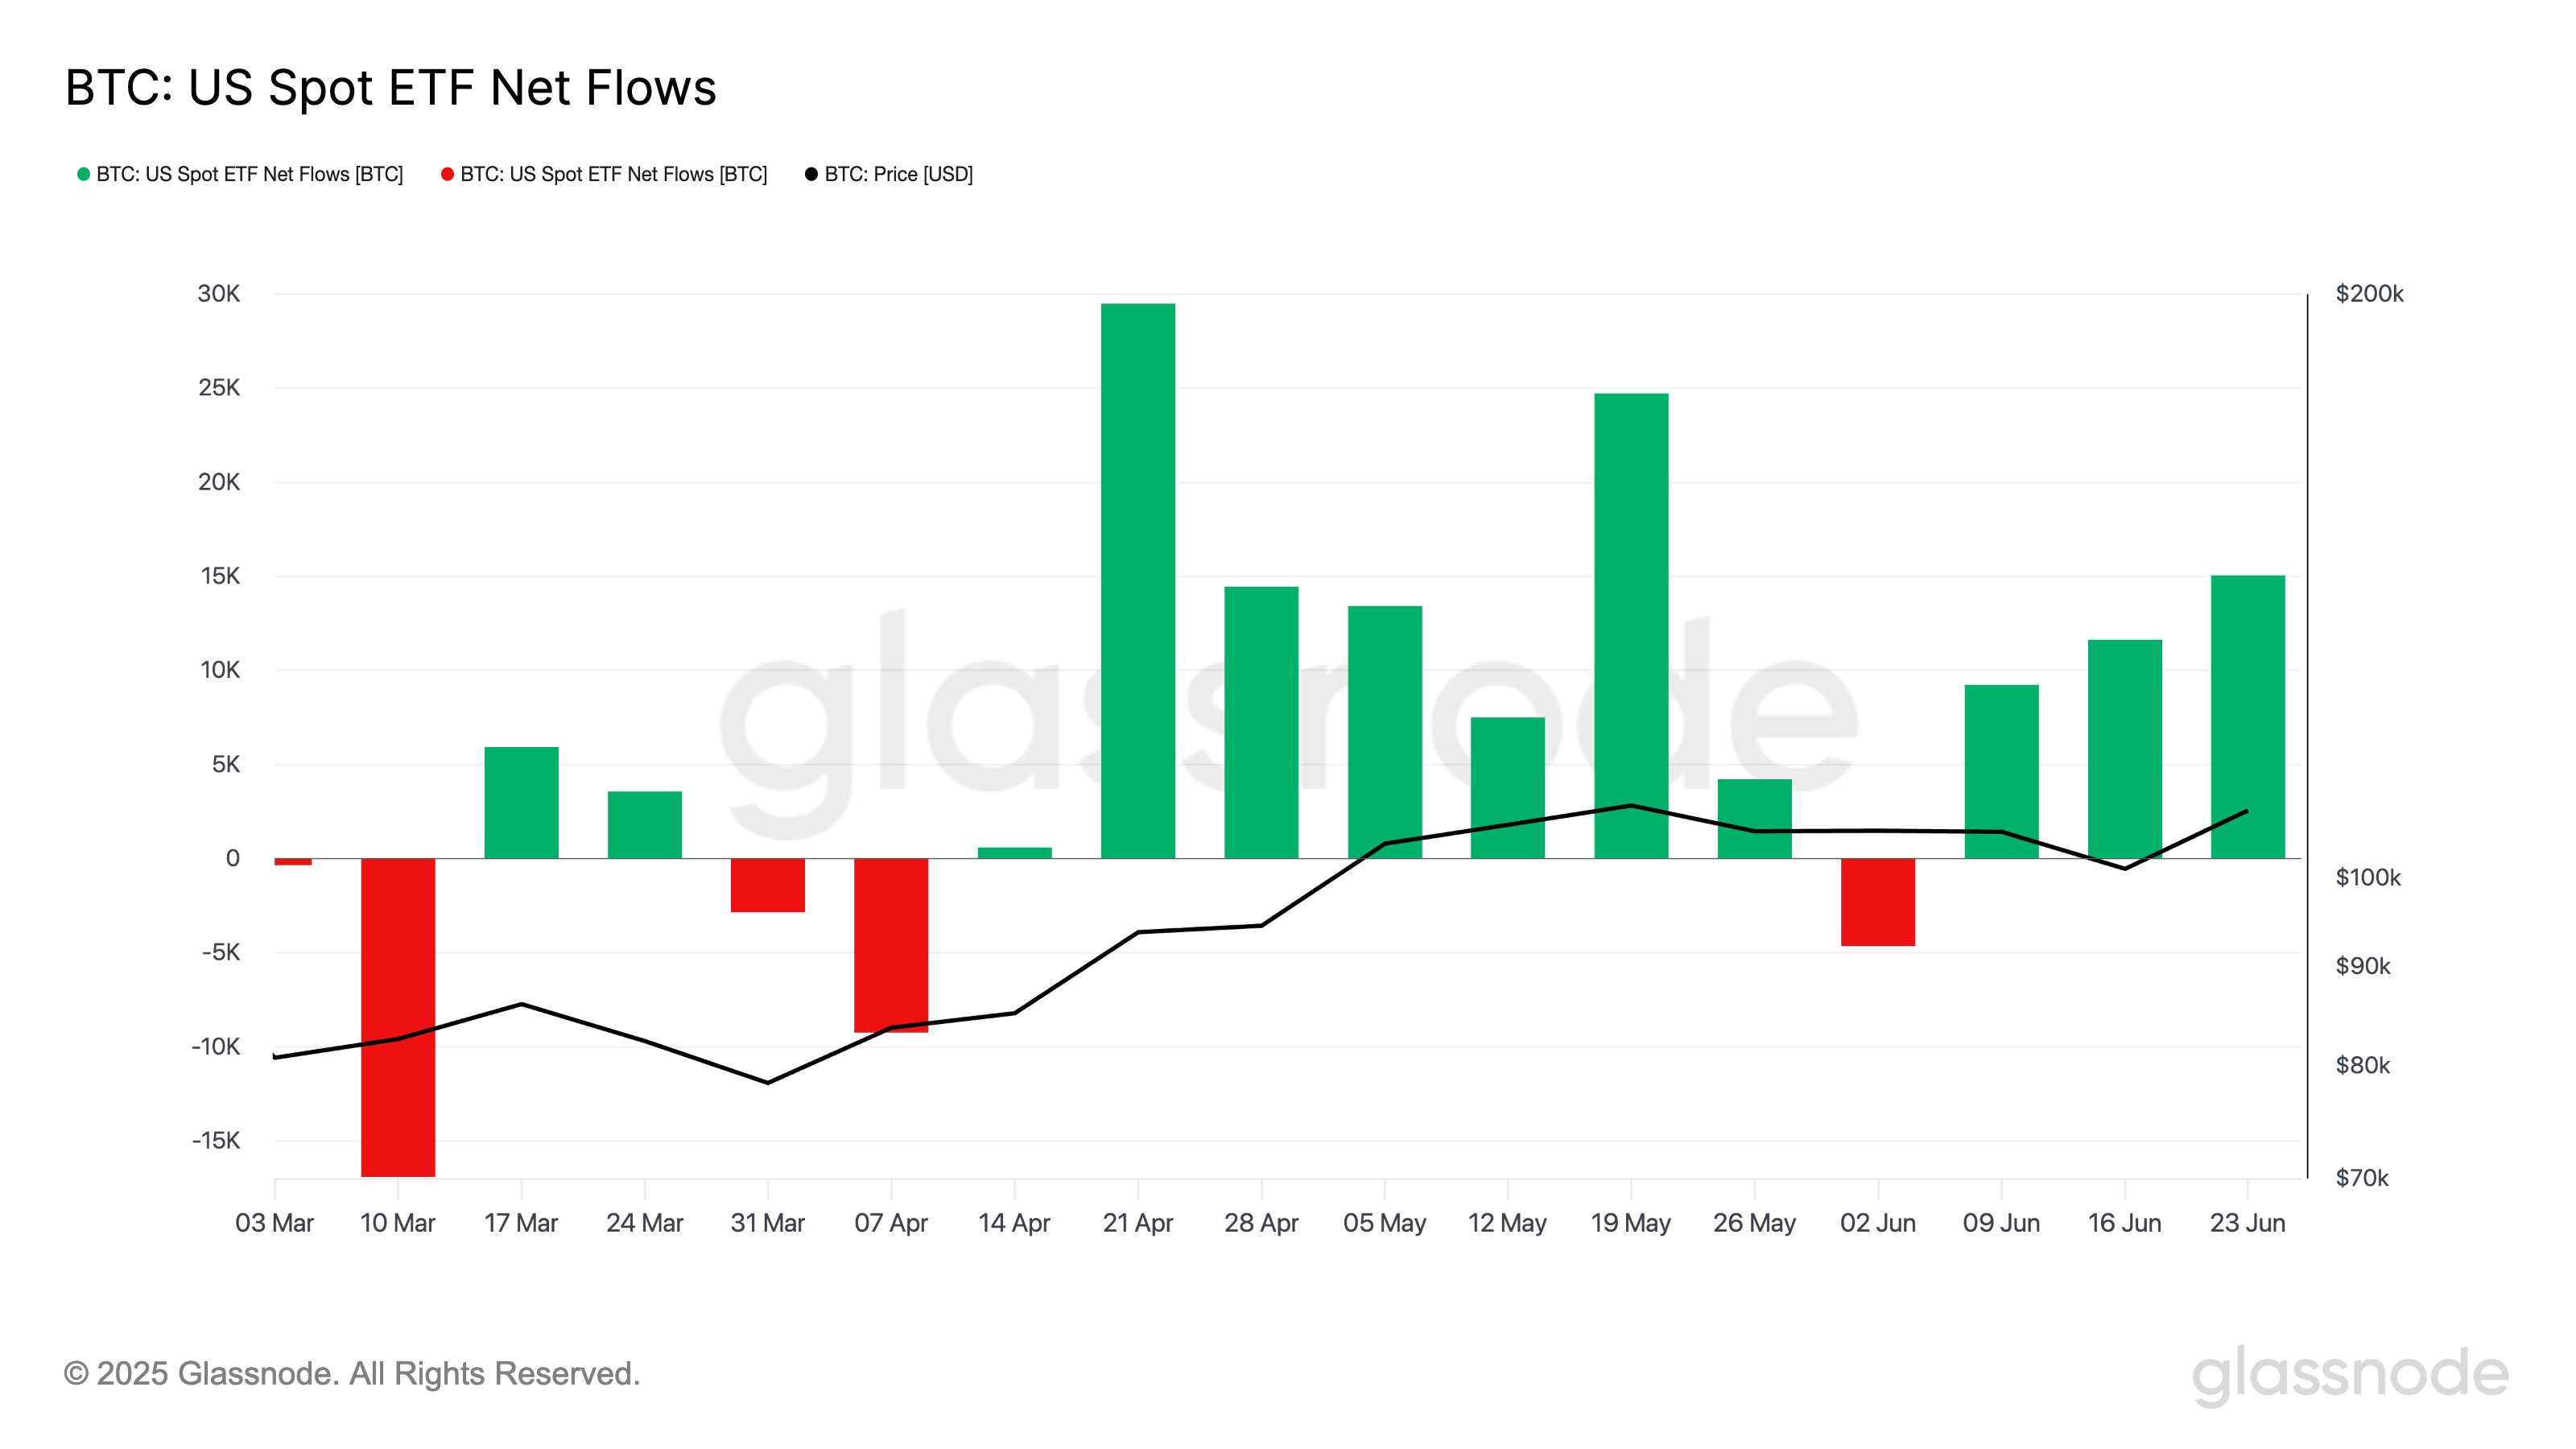
As displayed in the above chart, Bitcoin has also been seeing a green netflow for the US spot ETFs, but due to a week of outflows in early June, the streak only stands at three weeks for the asset.
During the latest week, around 15,000 BTC flowed into the ETFs. In USD terms, that’s equivalent to $1.6 billion. For comparison, inflows amounted to $258.6 million for Ethereum. Clearly, while both have seen demand, there is a clear difference of scale involved between the two.
From the graph, it’s apparent that the US Bitcoin spot ETFs saw an acceleration of demand over the course of June. It only remains to be seen, though, whether the trend would keep up in this month of July.
ETH Price
Ethereum crossed the $2,500 level earlier, but it seems the coin has since faced a pullback as its price is back at $2,400.
