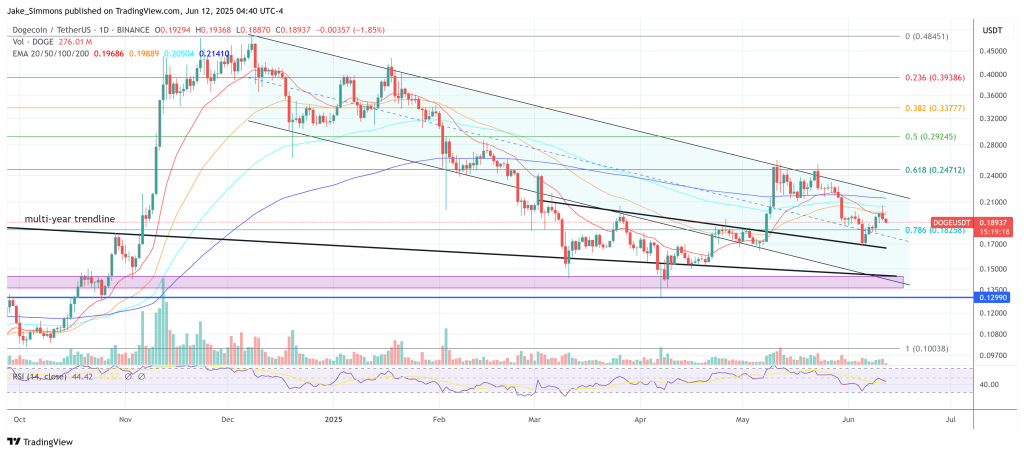
According to market technician Cantonese Cat (@cantonmeow) a single metric—the 20-month simple moving average—could be the line that could separate another vertical rally from a gut-wrenching breakdown for Dogecoin. Currently, DOGE sits comfortable above that moving average, now plotted at $0.1751. The black curve on Cat’s chart shows only three clean retests of the 20-month SMA since 2014.
All Eyes On Dogecoin’s 20-Month SMA
The first came in March 2017, when price tapped the average near $0.00020 and then ripped more than 9,000% into the January 2018 peak. The second occurred in the winter of 2020, with price kissing the average at roughly one-fourth of one cent before the parabolic 34,500% run to $0.73 the following May. The third and current encounter began in August last year when DOGE rallied by more than 480%.

As of today, two successive monthly candles dipped into the zone just below twenty-cents, but both were bought aggressively, leaving higher wicks and preserving the upward slope of the average. Cantonese Cat argues that as long as that moving average remains intact, “we’re going higher.” A decisive monthly close beneath $0.175 would, by this read, place the entire structure at risk and could usher in the sort of multi-month down-trend that followed the 2018 and 2021 climaxes.
TOTAL2 Needs To Break Out
Analyst Kevin (@Kev_Capital_TA) overlays that micro view on a much broader canvas. His chart tracks the total crypto market capitalization ex-Bitcoin (TradingView ticker “TOTAL2”) in monthly candles back to 2017. Two bold yellow trend-lines define a seven-year rising channel whose upper rail repelled price at the January 2018 and November 2021 alt-season tops. Since the June 2022 low, the market has carved out an ascending triangle: a rising series of higher lows presses against a flat-topped supply zone between roughly $1.43 trillion and $1.7 trillion.
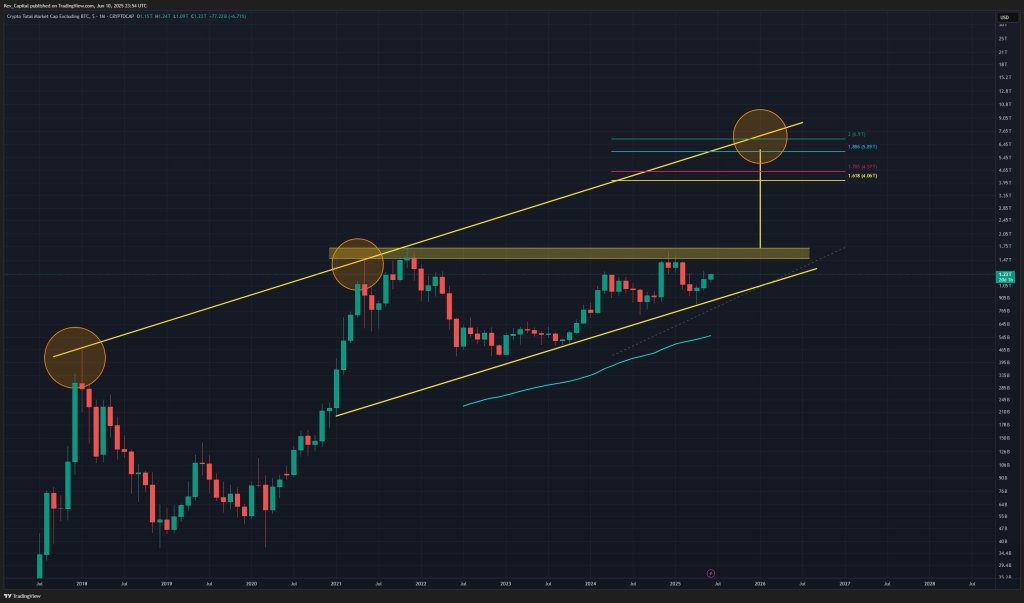
The apex of the triangle now looms; aggregate alt-cap is already worth about $1.2 trillion — all that stands between the current print and a confirmed breakout is a monthly close above the upper edge of that yellow rectangle. Kevin’s projection measures the height of the pattern and adds it to the breakout level, dropping a vertical marker that intersects the mid-channel near $5.89 trillion.
Kevin’s first Fibonacci extensions target is the 1.618 at $4.06 trillion. Higher extensions at 1.886, 2.0 and 2.618 cluster around $4.57 trillion, 5.89 trillion and $6.9 trillion respectively, the last of which coincides almost exactly with the channel’s ceiling and is circled as the analyst’s ultimate upside objective.
Why does that matter for Dogecoin? The meme-coin’s two explosive cycles began only after TOTAL2 had broken its own prior-cycle high and money poured into non-Bitcoin assets. Kevin states that “altcoins are just scratching the surface of what is possible in the coming months,” provided that macro-liquidity and regulatory factors permit capital rotation out of Bitcoin into the wider market.
In that scenario the 20-month SMA on DOGE would likely continue to slope higher, setting the stage for an explosive move higher. Conversely, failure of the alt-cap triangle would make a sustained loss of the SMA far more probable, robbing DOGE of its historical launch-pad.
For now, the indicator holds—and with it the prospect that Dogecoin could be primed for yet another bout of furious upside. But as both analysts caution, the monthly close will tell the story: above the 20-month SMA and an alt-cap breakout, or below it and back into hibernation.
At press time, DOGE traded at $0.189.