

Ethereum continues to face strong resistance near the critical 200-day moving average at $2.7K, with recent price behavior hinting at a potential bearish reversal.
The lack of sustained buying momentum suggests that a prolonged consolidation phase, possibly extending down toward the $2.2K support zone, is increasingly likely in the mid-term.
Technical Analysis
The Daily Chart
ETH continues to struggle below the critical 200-day moving average, currently positioned around the $2.7K mark. This level has consistently acted as a ceiling over recent weeks, signaling a firm zone of selling pressure and hesitation among buyers. The failure to reclaim this key threshold has led to signs of weakness, as the price begins to form a distribution range, hinting at a potential corrective move.
Given the lack of strong bullish momentum, a gradual decline toward the $2.2K support appears increasingly likely in the coming sessions. This zone may serve as a demand pocket, offering the market a reset opportunity before attempting another breakout above the $2.7K barrier. However, should sellers gain further control, Ethereum could even retest the 100-day MA near $2K as the next line of defense.
The 4-Hour Chart
On the lower timeframe, Ethereum is trading within a rising wedge formation, typically a bearish reversal pattern, indicating fading buyer strength and heightened risk of a downward breakdown. This structure aligns with visible bearish divergence on the RSI indicator, reinforcing the view that distribution is underway near the current resistance.
A breakdown below the wedge’s lower boundary, currently around $2.4K, would likely open the door to a drop toward the $2.2K zone. Conversely, if Ethereum unexpectedly breaks above the upper boundary, a rapid short squeeze could unfold, potentially propelling the price toward higher resistance levels in a sharp recovery move.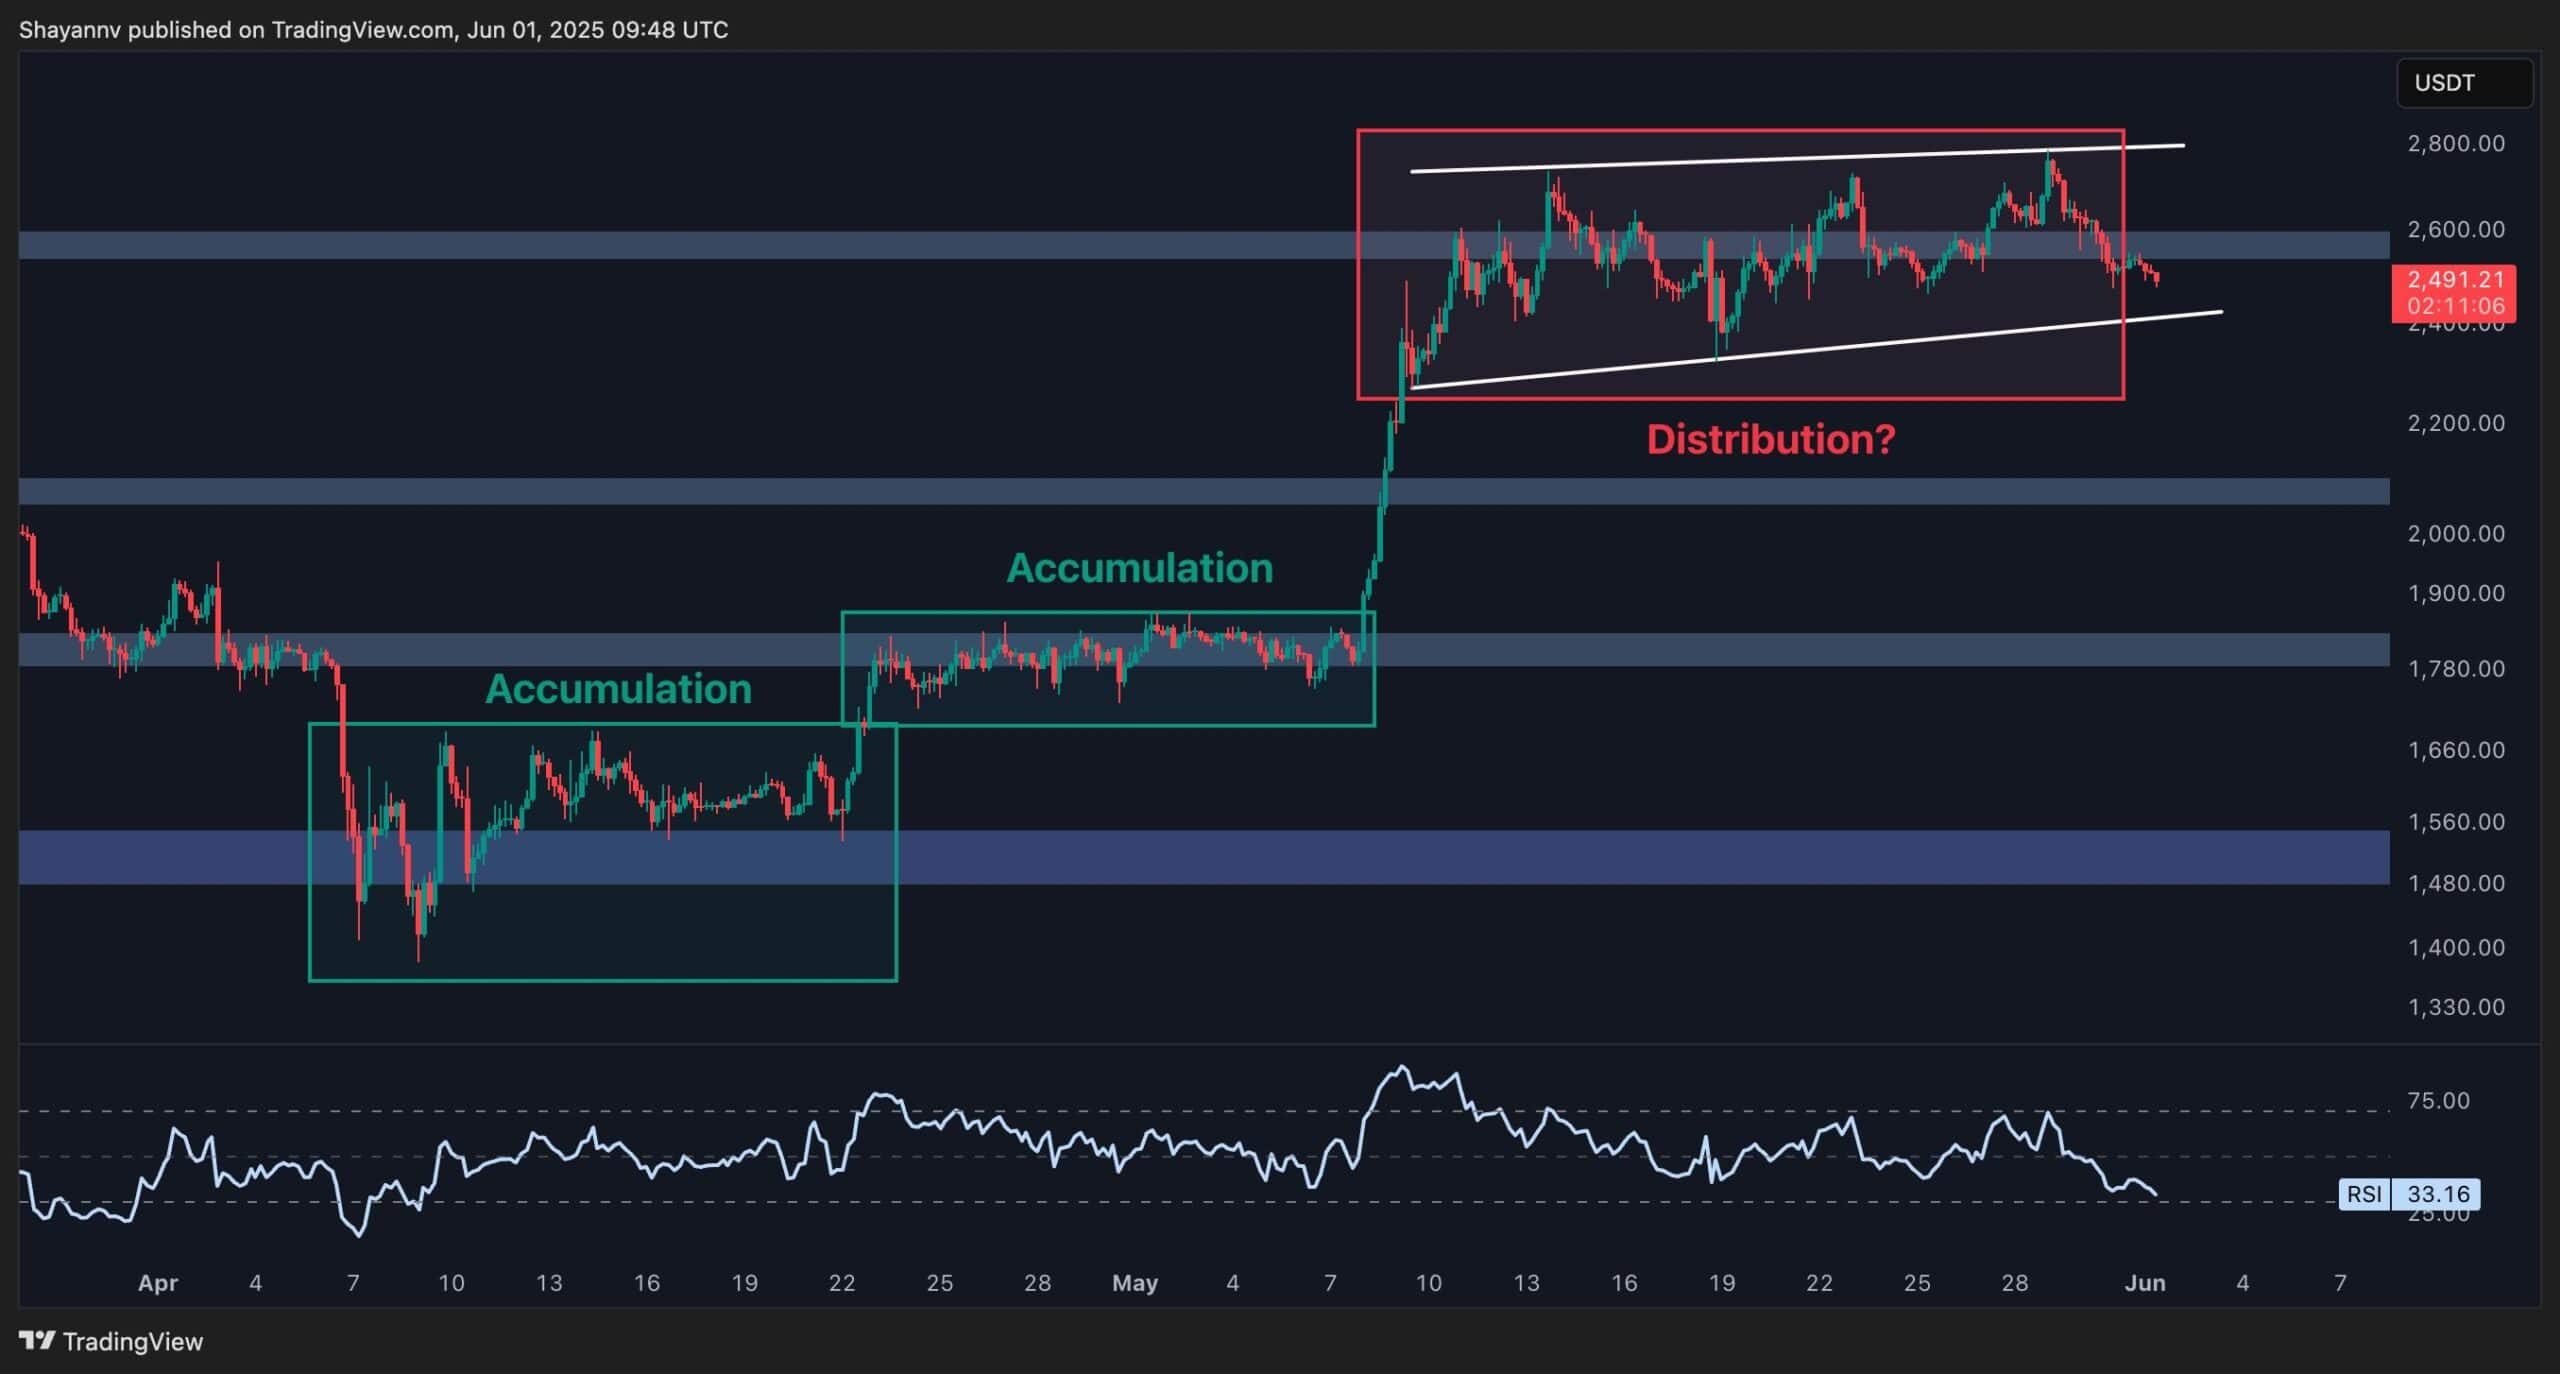
On-Chain Analysis
Ethereum’s price continues to fluctuate just beneath a key resistance zone, leaving traders uncertain about the asset’s next significant directional move. One valuable metric in this context is the Average Order Size of Executed Trades, which reveals the scale of activity from different market participants.
A surge in this metric often points to increased participation from whale investors. Historically, larger order sizes have coincided with major local tops, as whales tend to engage in strategic profit-taking or distribution at elevated price levels.
At present, this metric has climbed noticeably, signaling heightened whale activity within the critical $2.5K to $2.8K resistance band. This pattern suggests that large investors may be offloading positions or hedging, anticipating a potential shift in momentum.
As a result, barring a surprise bullish breakout, the odds currently favour continued consolidation or even a deeper pullback in the mid-term, possibly toward lower support levels. Investors should remain cautious and watch for further cues from both price structure and institutional behaviour.
The post Will ETH Retest the $2K Support as Momentum Fades? Ethereum Price Analysis appeared first on CryptoPotato.
