

Ripple remains confined within a narrow price range, with minimal fluctuations in recent action. This low-volatility environment suggests an imminent breakout, which will likely define the next major trend.
XRP Analysis
The Daily Chart
XRP is currently trading within a narrow and critical price range, bounded by the 100-day and 200-day moving averages at $2.2, and the descending wedge’s upper boundary near $2.5. This consolidation range marks a pivotal battleground between bulls and bears.
The muted price action and the RSI hovering around the neutral 50 zone reflect a state of equilibrium, suggesting that market participants are awaiting a breakout to define the next trend.
Should XRP find support from the key moving averages and successfully break above the descending wedge, a bullish rally toward the $3.3 region becomes likely. However, failure to reclaim the $2.5 resistance may trigger a bearish rejection, with downside risk toward the $2 support level.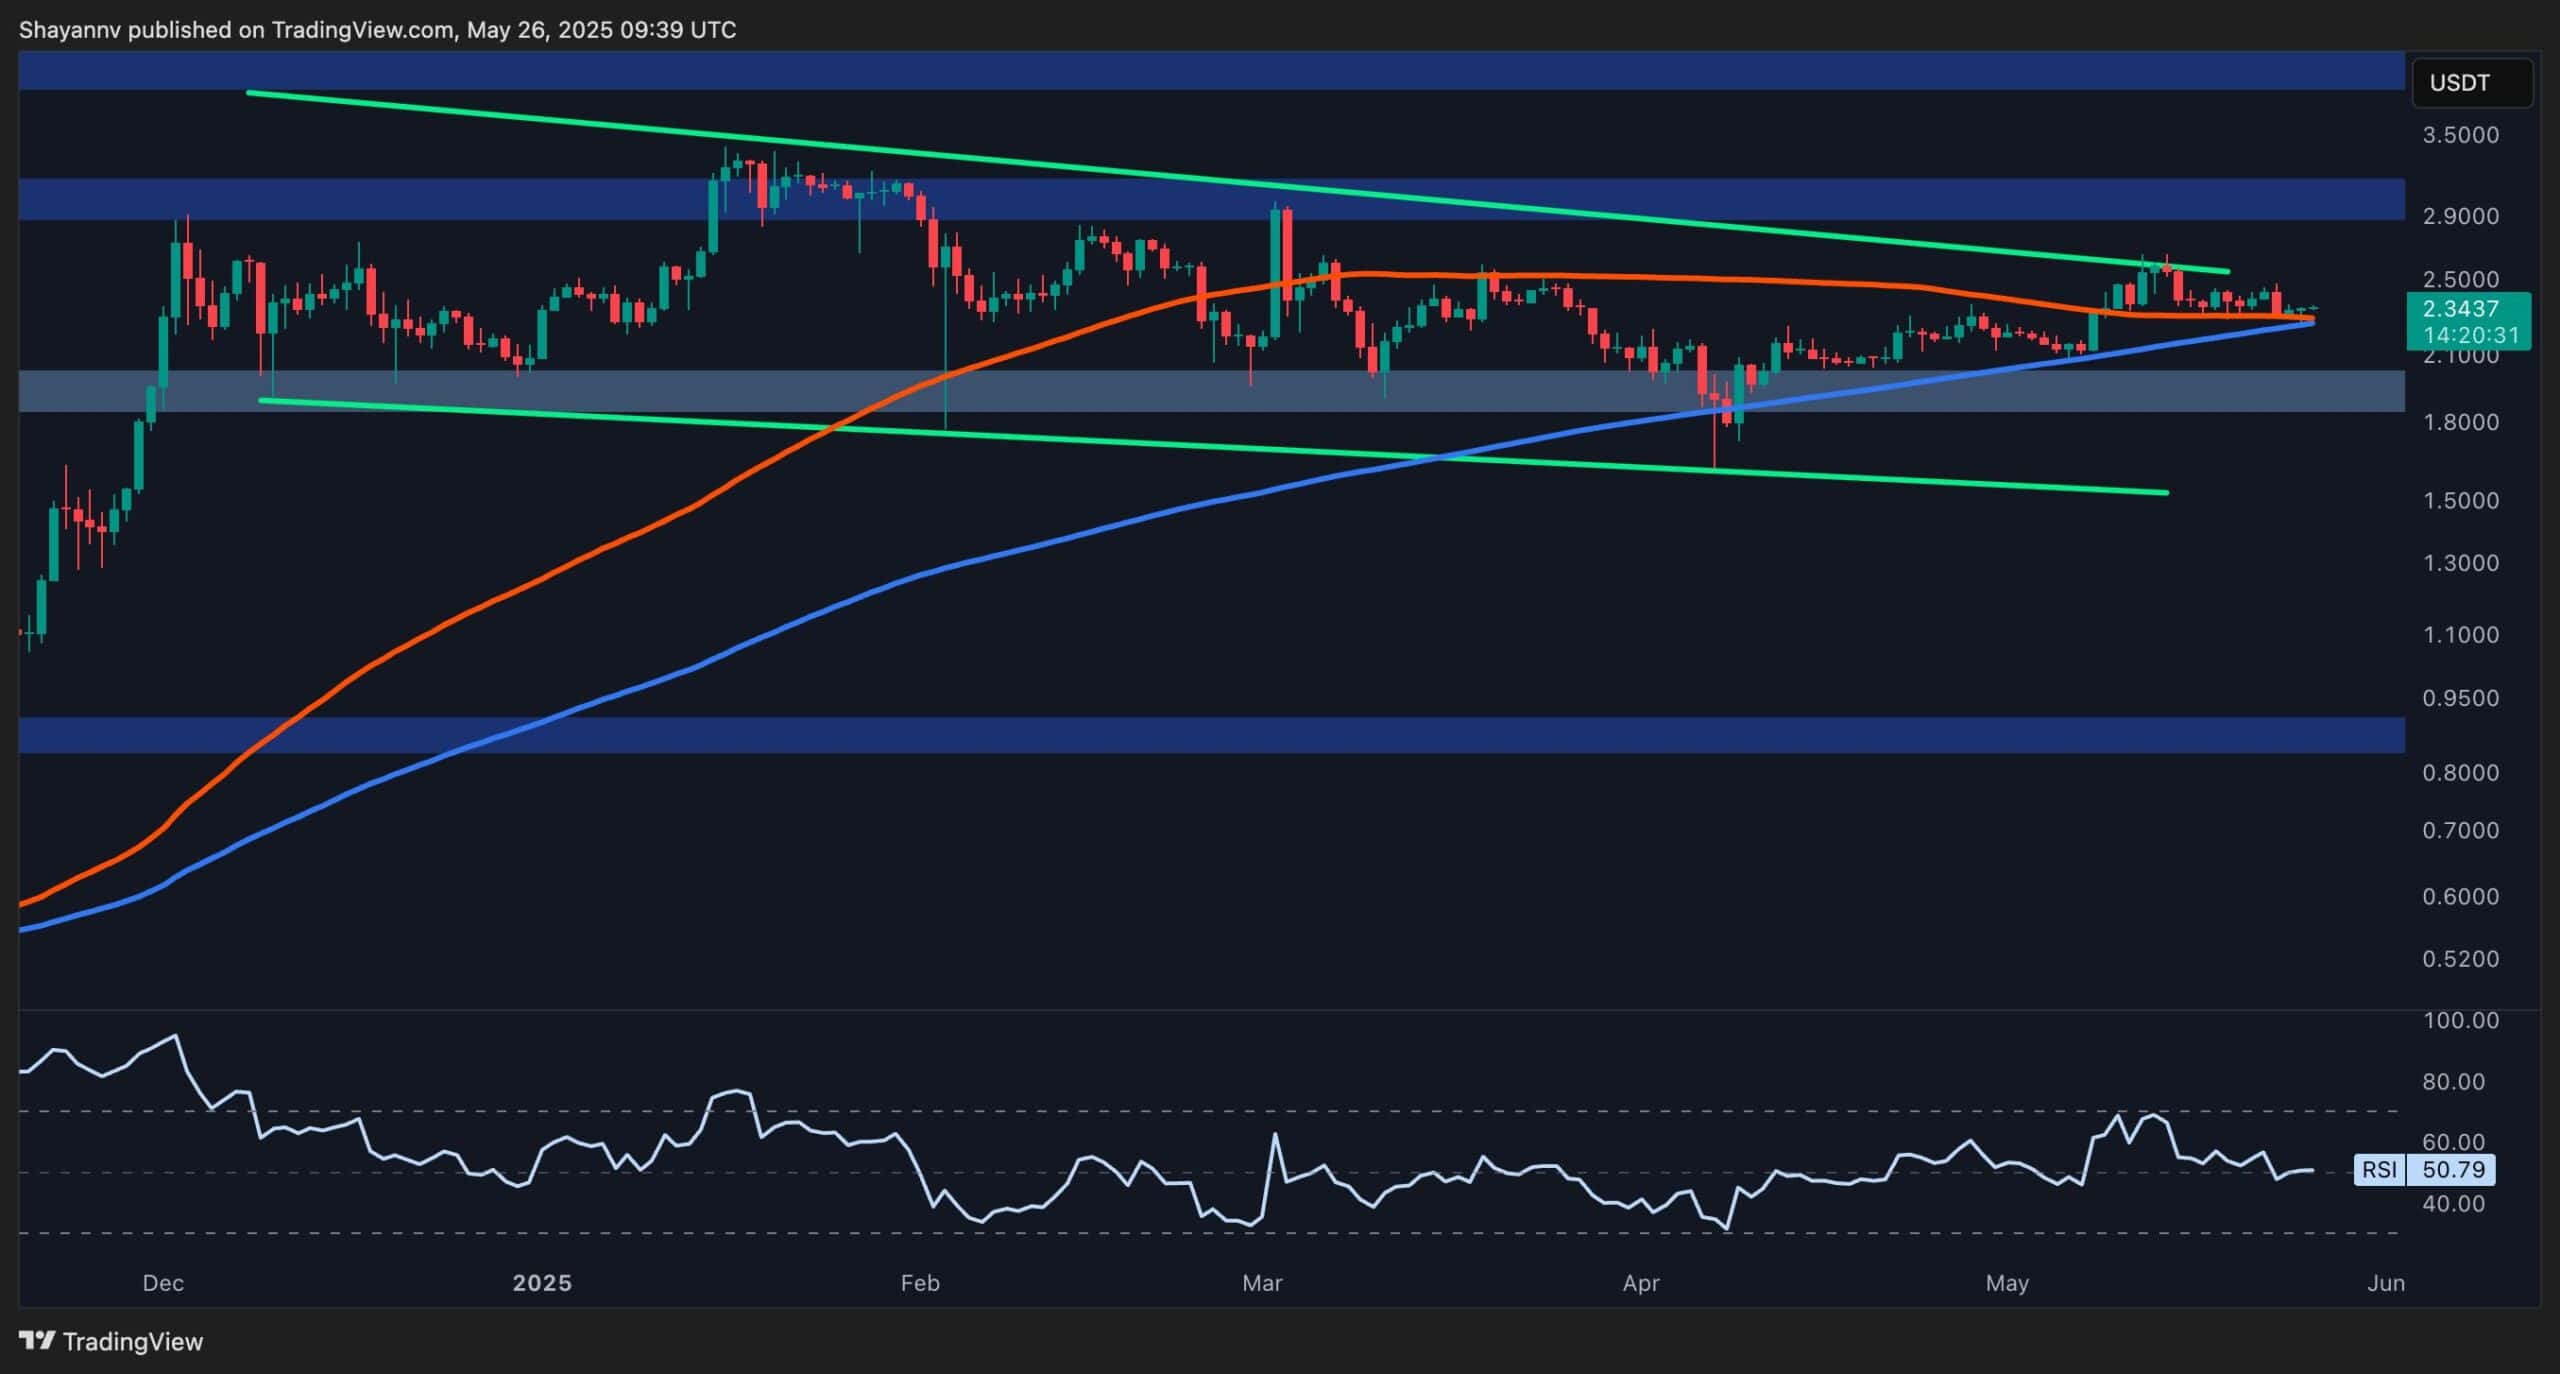
The 4-Hour Chart
On the lower timeframe, Ripple has formed a short-term descending wedge, typically considered a bullish continuation pattern. The price is consolidating at the wedge’s lower boundary near $2.2, showing low volatility as traders await a catalyst.
If XRP breaks above the wedge’s upper trendline and reclaims the $2.4 level, it will likely confirm a bullish breakout, setting the stage for a rally toward the $2.8 resistance. Conversely, a failure to break out and a subsequent drop below $2.2 could result in a bearish move toward $2.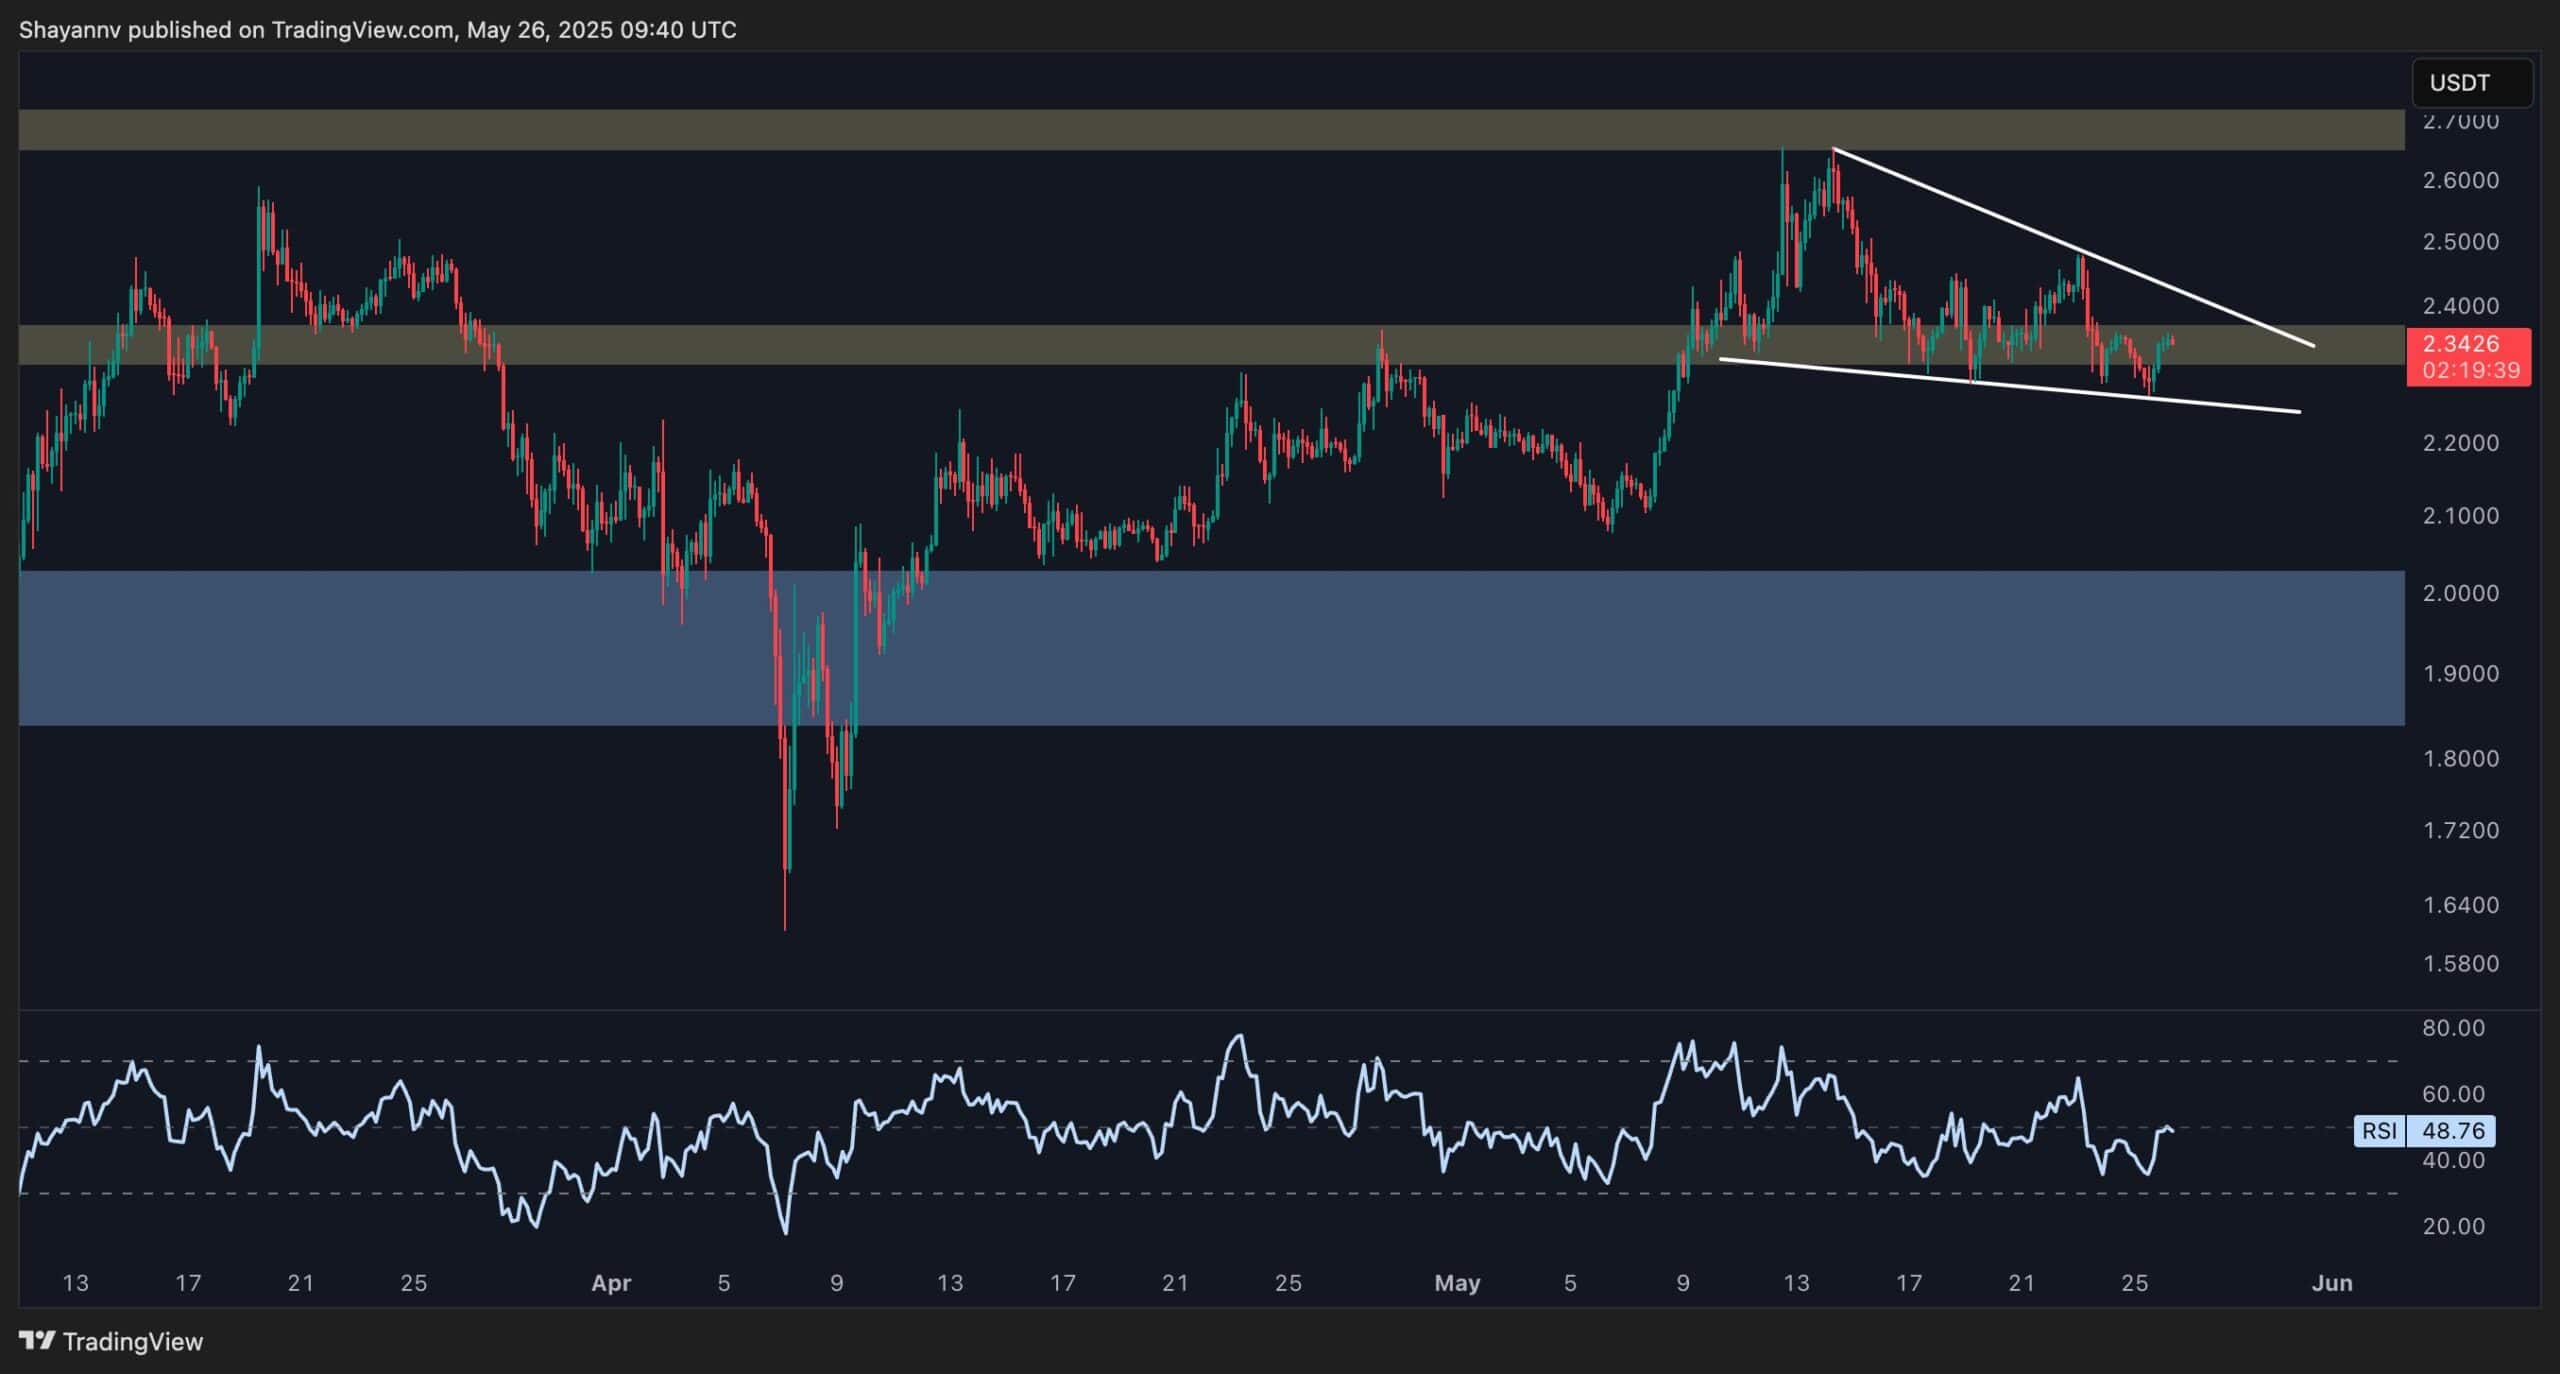
The post Possible Scenarios for XPR Once it Breaks Out of Consolidation: Ripple Price Analysis appeared first on CryptoPotato.
