

While Bitcoin and other major cryptocurrencies have surged to new all-time highs, Tron (TRX) has remained in a tight consolidation range. Despite the broader market’s bullish momentum, TRX is still trading nearly 66% below its early December peak. However, this lagging price action has not gone unnoticed—investors and analysts are increasingly watching Tron as a potential breakout candidate.
As one of the top-performing Layer-1 blockchains over the past year, Tron’s fundamentals remain strong. The network continues to lead in stablecoin settlement volume and user activity, positioning it well for renewed upside if altcoins follow Bitcoin’s lead. Recent on-chain data from CryptoQuant adds to the optimism: the Buy/Sell Pressure Delta, which measures net buying or selling activity over the past 90 days, shows that TRX has re-entered a buying pressure zone.
Historically, this signal has preceded bullish price movements, especially when combined with strong fundamentals and improving market sentiment. If buying pressure persists and price breaks above current resistance levels, Tron could stage a significant rally to catch up with the broader market. For now, all eyes are on whether this fresh demand can spark TRX’s next leg higher.
Tron Holds Strong As Bullish Momentum Rebuilds
Tron (TRX), one of the most resilient altcoins in recent years, continues to show strength despite a challenging environment for most non-Bitcoin assets. Since late 2022, TRX has followed a steady uptrend, defying broader market corrections and maintaining strong on-chain fundamentals. Now, the asset consolidates near critical technical levels, preparing for what could be its next leg upward.
Although Bitcoin has clearly led the current cycle—hitting new all-time highs and attracting the majority of capital—many altcoins like Tron are still lagging. This divergence has led several analysts to question whether an altseason is still on the table. Most believe this is a Bitcoin-dominant cycle, especially given the inflow to BTC ETFs and macroeconomic uncertainty. However, hope remains for a rotation into altcoins.
Supporting that optimism, CryptoQuant insights reveal that TRX has returned to a buying pressure zone. The Buy/Sell Pressure Delta shows a clear transition out of the selling pressure area. Demand is once again exceeding supply, favoring bulls.
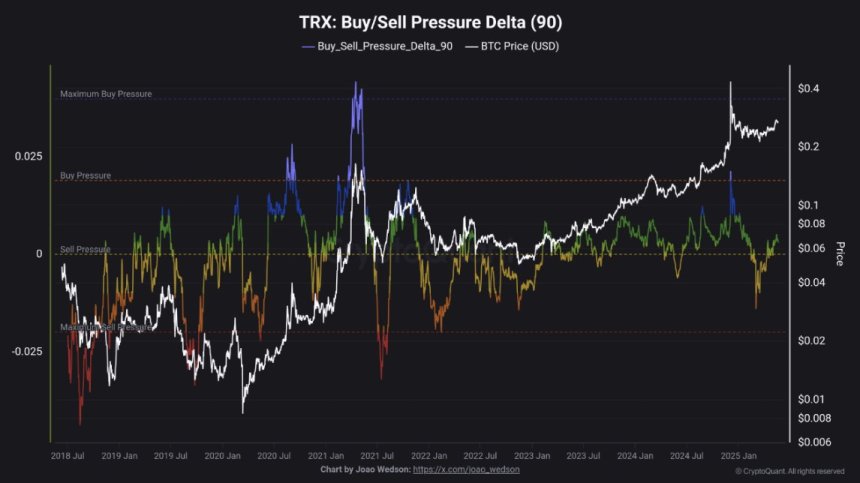
Importantly, TRX has not yet reached the historical thresholds that typically precede price tops. This suggests that there is still room for growth before caution sets in. If the broader market supports a rotation, Tron could emerge as a standout Layer-1 performer once again, especially as traders search for strong setups beyond Bitcoin.
Technical Analysis: Bulls Defend Higher Lows Above Support
The daily chart for Tron shows that the asset is consolidating after a strong push toward the $0.28 resistance zone. Price action has maintained a clear bullish structure since early April, with higher lows forming consistently along the 34-day EMA ($0.26), which now acts as dynamic support. The 50, 100, and 200 SMAs are all trending upward and tightly aligned beneath the current price, signaling long-term bullish alignment.
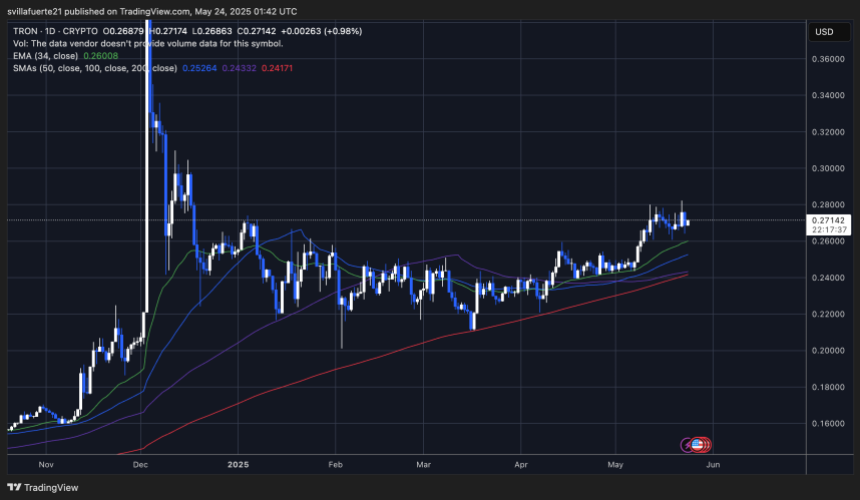
TRX remains in a short-term consolidation range between approximately $0.26 and $0.28. The price recently tested this upper boundary twice but failed to break through with strong momentum. However, support at $0.26 has held firmly, suggesting buyers are still in control.
To confirm a breakout, bulls must decisively push the price above $0.28 with higher volume, which could open the door to a move toward $0.30 and potentially retest December’s highs near $0.36. On the downside, losing $0.26 would weaken this setup and likely trigger a drop toward the $0.2430 region, where the 100 SMA currently sits.
Featured image from Dall-E, chart from TradingView
