

Bitcoin has returned to a key technical level that has played a central role in previous rallies. The 50-week Simple Moving Average (SMA), often called the bull market baseline by traders, has acted as a reliable support zone since early 2023.
As of press time, Bitcoin is trading at around $111,200, showing a modest daily gain while still down over the past week.
Bitcoin Retests Long-Term Support
The chart shared by Merlijn The Trader shows that each time Bitcoin has retested the 50-week SMA since 2023, it has gone on to make new highs. The moving average has become a key level for identifying changes in trend. In early 2022, Bitcoin broke below it, marking the start of a broader correction.
Since then, however, the price has repeatedly returned to this line before continuing higher. The most recent touch of the SMA has once again attracted attention from traders watching for signs of a new upward move. Merlijn stated:
BITCOIN JUST RETESTED THE BULL MARKET BASELINE.
The 50-week SMA marked every major liftoff since 2023.
Smart money buys the retest.
Retail buys the breakout.This chart separates traders from tourists. pic.twitter.com/hw8hWmOKPJ
— Merlijn The Trader (@MerlijnTrader) October 20, 2025
Sentiment Still Unsettled After Liquidation
Market confidence remains low following a large liquidation event on October 10. Funding rates, which reflect the cost of holding long or short positions in the futures market, dropped into negative territory on October 17. This suggests that many traders were leaning toward short positions, betting on further declines.
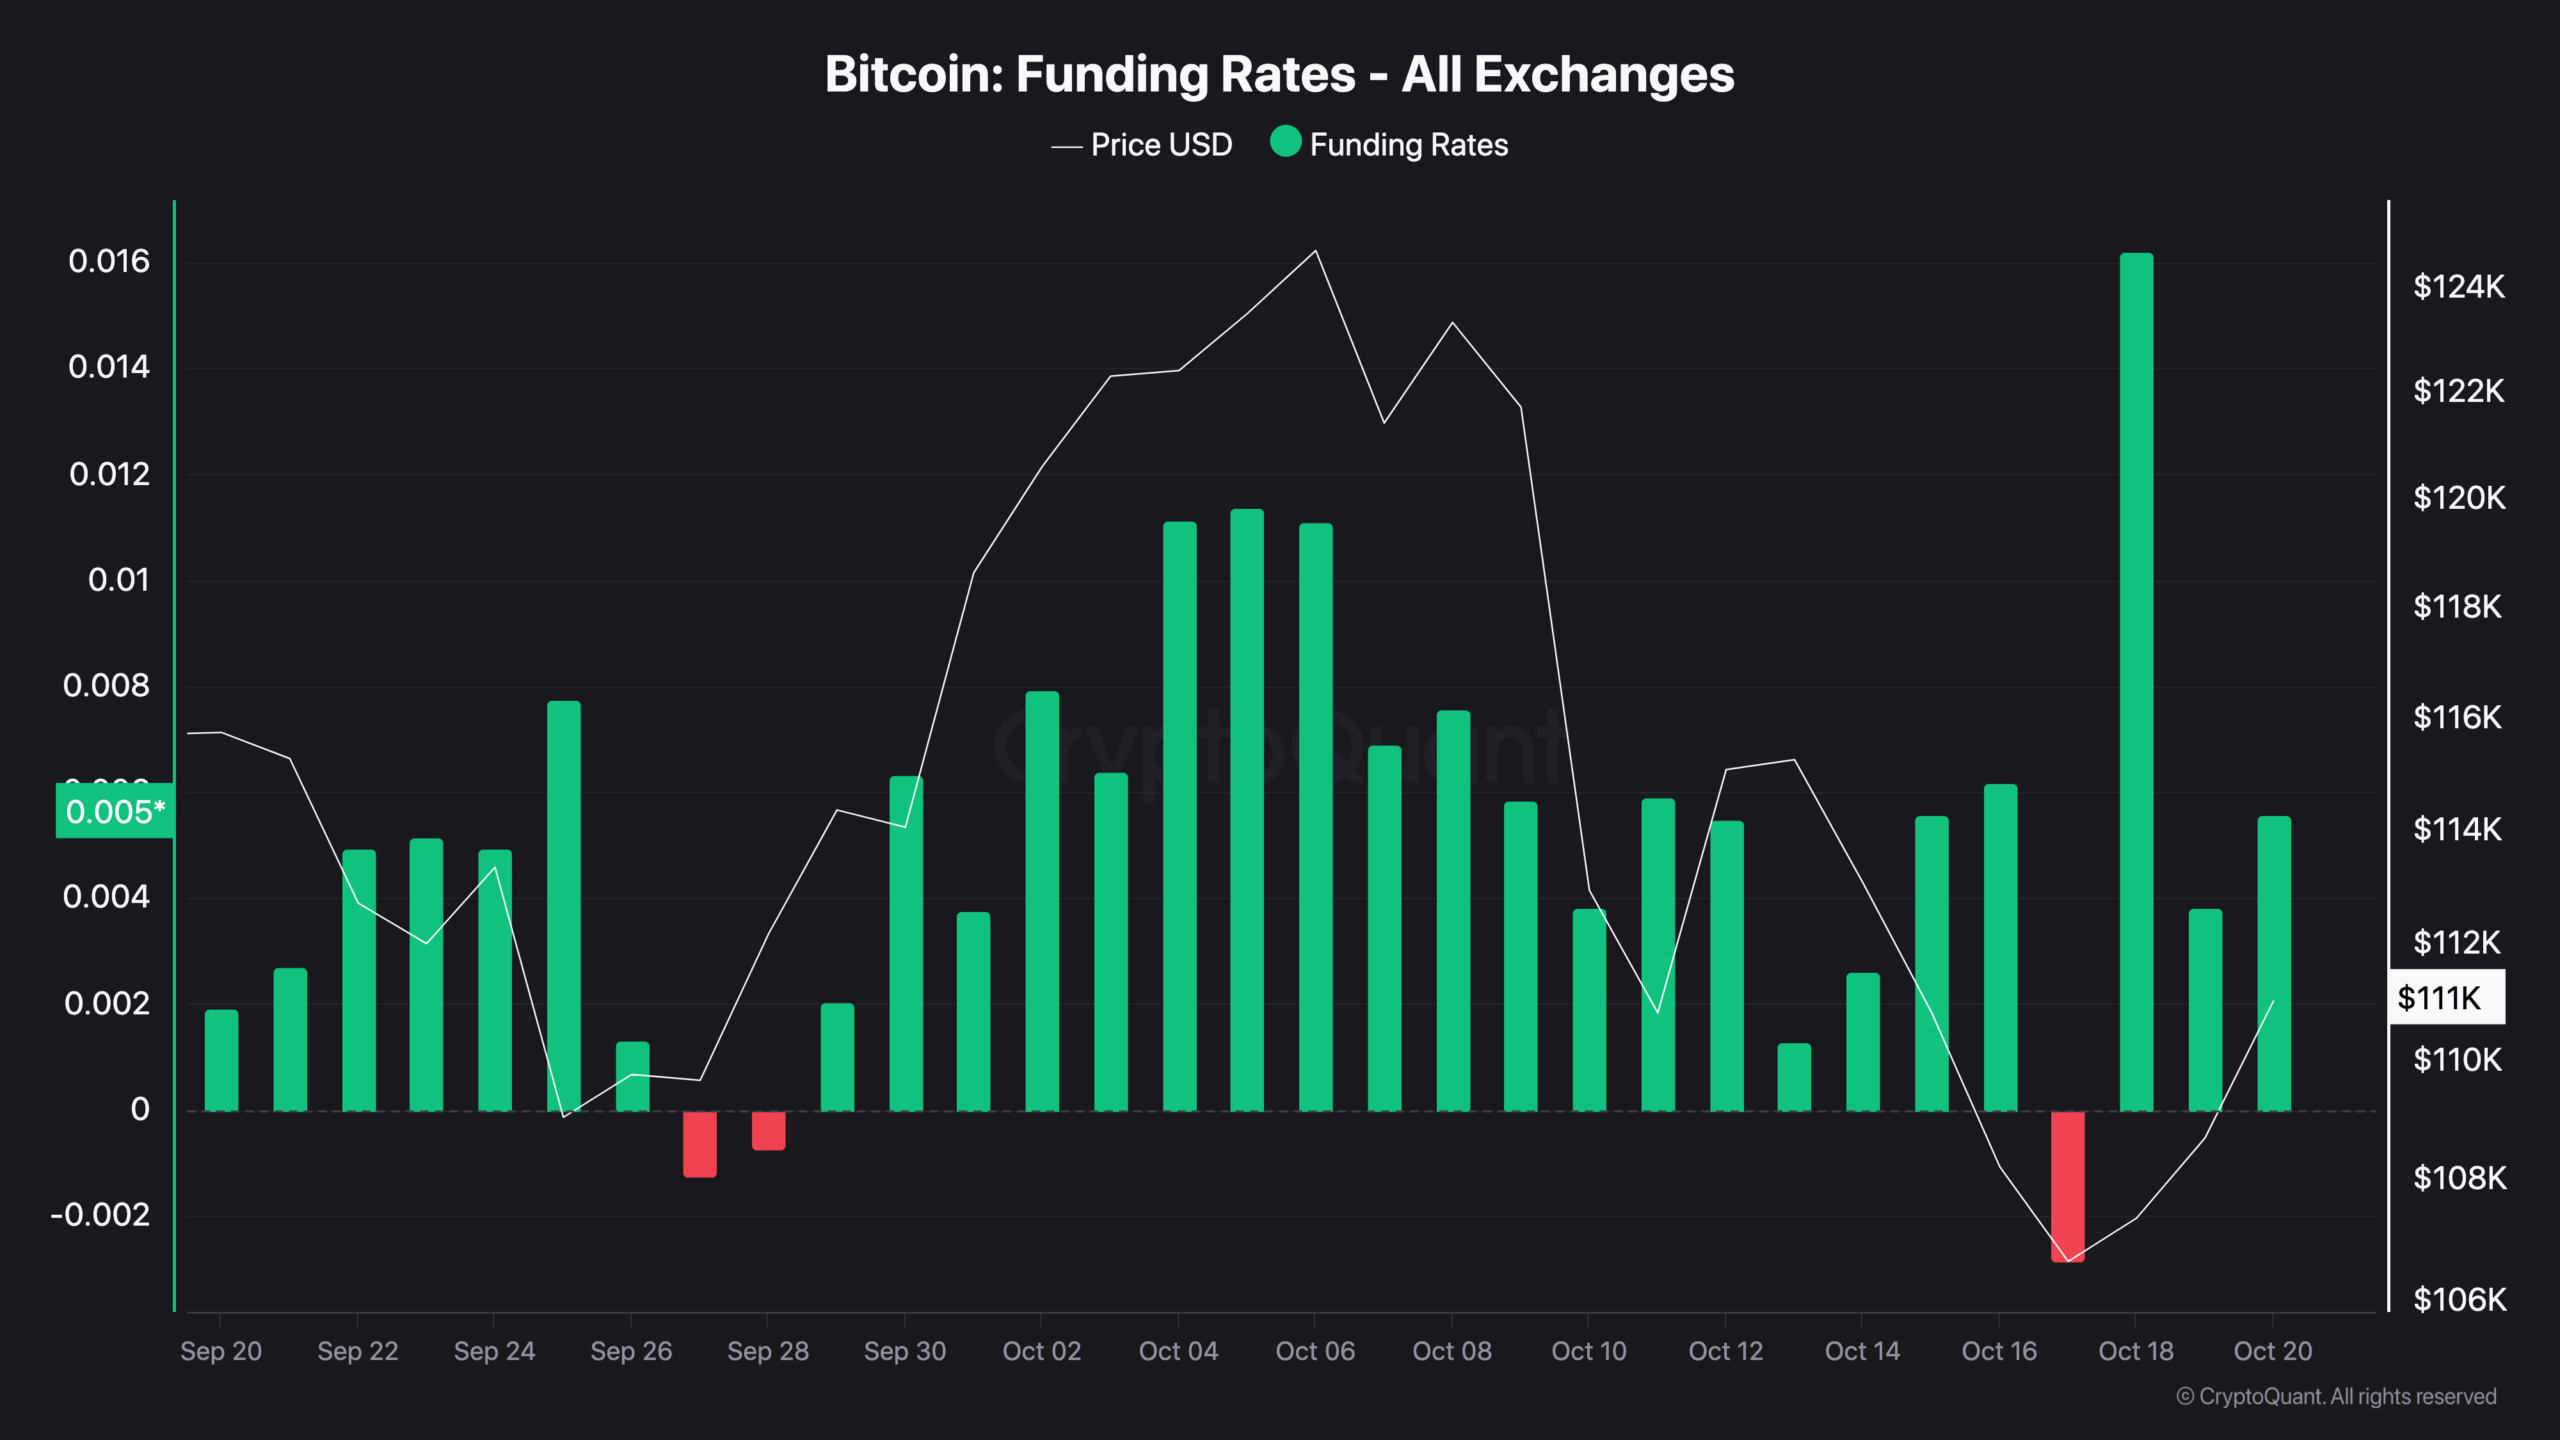
Since then, funding rates have recovered and are now back above 0.005. Although this shift shows some return of buying interest, the caution in the derivatives market shows that traders are not yet fully convinced by the rebound. This kind of hesitation is common after a strong pullback, especially when losses were sudden.
Key Price Levels in Play
Bitcoin is currently trading near a resistance area at $111,440. This level marked the start of a previous decline that took the price below $108,600. According to analyst Lennaert Snyder, breaking and holding above $111,440 could open the way for a move toward $115,800. If that level is also cleared, price may revisit $120,800, where a fast selloff occurred earlier.
Bitcoinsensus reported that the weekly candle closed above the $107,200 low, a move that could support a continued push higher. They also noted that the Bitcoin liquidity index has started to rise for the first time since July, a possible sign that new capital is entering the market.
Broader Trends and External Pressure
EGRAG CRYPTO noted that Bitcoin appears to be following a recurring pattern. The analyst suggested that the market may be entering the final stage of an upward cycle. Suggesting that a sharp reversal could follow after retail participation increases, EGRAG added,
“Everyone will think we’re finally safe… but that’s where the real twist comes.”
Notably, the recent correction was partly driven by political news, as we reported. A drop at the end of last week followed comments from former US President Donald Trump about new tariffs on China. This created uncertainty across financial markets and added pressure on crypto assets.
As reported by CryptoPotato, data from prediction platform Polymarket showed some skepticism in the retail space. Their latest odds gave a 6% chance of aliens being confirmed this year, compared to just 5% for Bitcoin reaching $200,000. While meant to entertain, it reflects how cautious traders have become in setting near-term expectations.
The post Bitcoin Hits Key Support: Bull Run or Bull Trap? appeared first on CryptoPotato.
