

Bitcoin is trading in a high range as the end of the year approaches. One chart shows possible signs of a slowdown, while others suggest the trend remains in place.
Analysts and traders are watching as the debate grows around whether a move to $250,000 is still on the table.
Divergence on Weekly Chart Raises Doubts
Analyst Ali Martinez shared a weekly chart showing a bearish divergence. The price has made new highs, but the Relative Strength Index (RSI) has not followed. This pattern has appeared before major pullbacks in past cycles.
The chart illustrates Bitcoin fluctuating around the $112,900 mark following its latest $116,000 weekly peak. RSI, however, has made lower highs since 2021. The divergence between price and momentum raises concern that the current rally may be losing strength. A rounded top shape has also formed, which some view as a warning sign. Martinez questioned the chart, asking,
Be honest!
Does this setup look like $250,000 Bitcoin $BTC by December? pic.twitter.com/RFlRnnoFHk
— Ali (@ali_charts) October 15, 2025
Monthly Structure Remains Strong
Michaël van de Poppe offered a different view using the monthly chart, as the price action remains in an uptrend. There are no steep spikes or signs of a blow-off top. Bitcoin is holding above the monthly moving average.
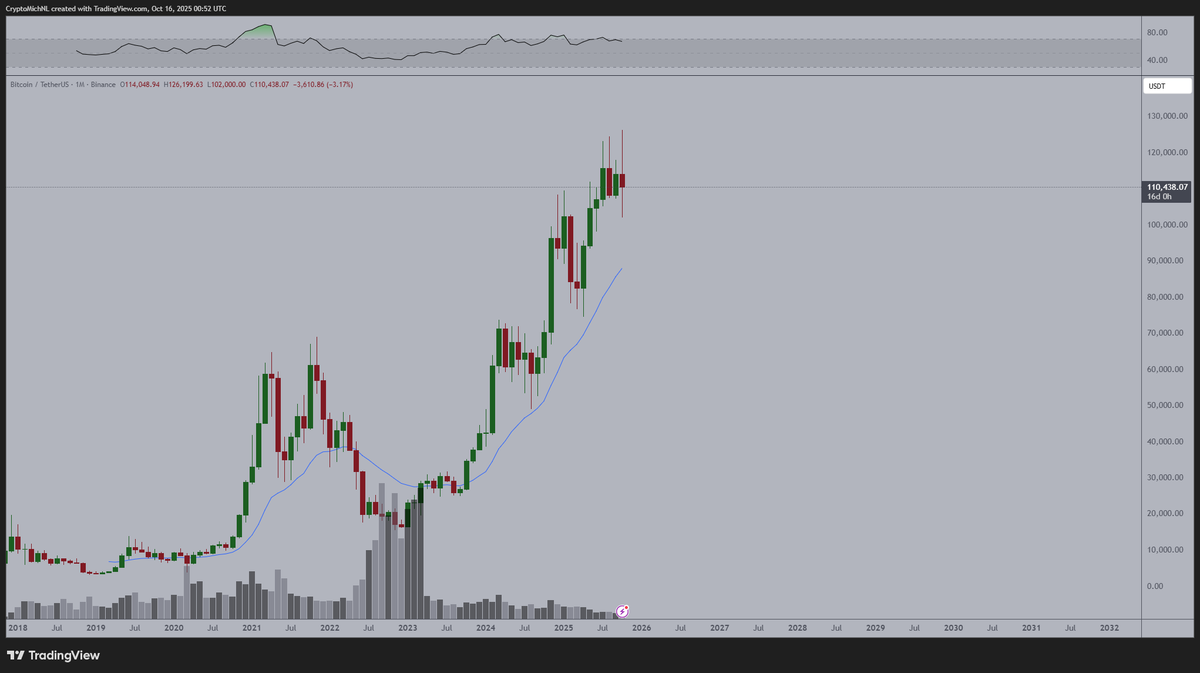
Poppe commented that the market remains in good shape, with the chart indicating a continuous rise from 2023. The RSI is not in a critical zone, and volume has decreased from the previous high levels. The patterns on the candles do not indicate any significant reversals.
“It’s just uptrending… just buy the dip.”
Mid-Term Holders Take Profits as Old Coins Move
New data from Binance, reported by Arab Chain, shows that short- and mid-term holders are active. The 6–12-month group accounts for $240.7 billion in realized supply. Other high-value groups include the 1–3-month and 3–6-month bands.
The 3–5-year category has grown to $101.7 billion, marking renewed activity from holders who had remained inactive since the 2020–2021 cycle. This group becoming active often signals that a rally is entering its later stages. In contrast, coins held for more than five years continue to stay off the market, which may help support overall price stability.
Gold has been climbing steadily in recent months. Some market watchers suggest this could support Bitcoin’s momentum. As reported by CryptoPotato, gold has reached a zone that has previously lined up with stronger moves in BTC. While the link is not exact, the timing adds context to current market expectations.
The Bitcoin situation is crucial, with mixed charts and changing on-chain activities. It is still uncertain if Bitcoin will hit $250,000 by the end of the year, but the market is still paying attention to price and momentum.
The post $250K Bitcoin by Year-End? Here’s Why Analysts Are Split appeared first on CryptoPotato.
