

TL;DR
- Bitcoin’s cycle charts show cup & handle formations that historically triggered steep breakout expansions.
- Analysts track support at $111K and $90K–$92K, with upside resistance mapped toward $123K.
Recurring Cycle Patterns
Crypto analyst Merlijn The Trader shared that Bitcoin’s chart is once again following a familiar structure. His viewpoint highlights recurring cycle patterns that have characterized past market phases. In earlier years, Bitcoin formed a rounding bottom during 2015–2017, an Adam & Eve pattern in 2018–2020, and a cup-and-handle formation in 2021–2024. Each setup ended with a steep expansion in price.
He linked these expansions to the Relative Strength Index (RSI) crossing above 70, calling it the “ignition switch.” Merlijn wrote,
BITCOIN’S PLAYBOOK NEVER CHANGES
Rounding Bottom. Adam & Eve. Cup & Handle.
Every cycle it ended the same way: EXPANSION.RSI 70 is the ignition switch.
Once flipped, Bitcoin doesn’t climb… it detonates.DON’T GET SHAKEN OUT NOW! pic.twitter.com/WtXrZb7E4b
— Merlijn The Trader (@MerlijnTrader) September 25, 2025
His chart indicates that the market may be in the middle of completing another cup-and-handle structure, with an expansion phase starting.
Key Support and Resistance
Analyst Michaël van de Poppe noted that BTC is holding near $111,600, where a red support block between $111,500–$112,000 has been tested several times. He pointed to resistance around $114,755 and $116,813, while a stronger supply zone remains at $118,000–$119,500. Clearing that level could lead to a move toward $123,288.
Van de Poppe also mapped an accumulation range lower on the chart, between $100,740–$103,190, where volume previously spiked. He commented,
Not much strength on $BTC either, after a strong day yesterday.
What to expect?
I would assume that we’ll be going to get some more downside and then we’re done for the current period, meaning that we’ll be in up-only mode. pic.twitter.com/copk4O5z87
— Michaël van de Poppe (@CryptoMichNL) September 25, 2025
Long-Term Trendline
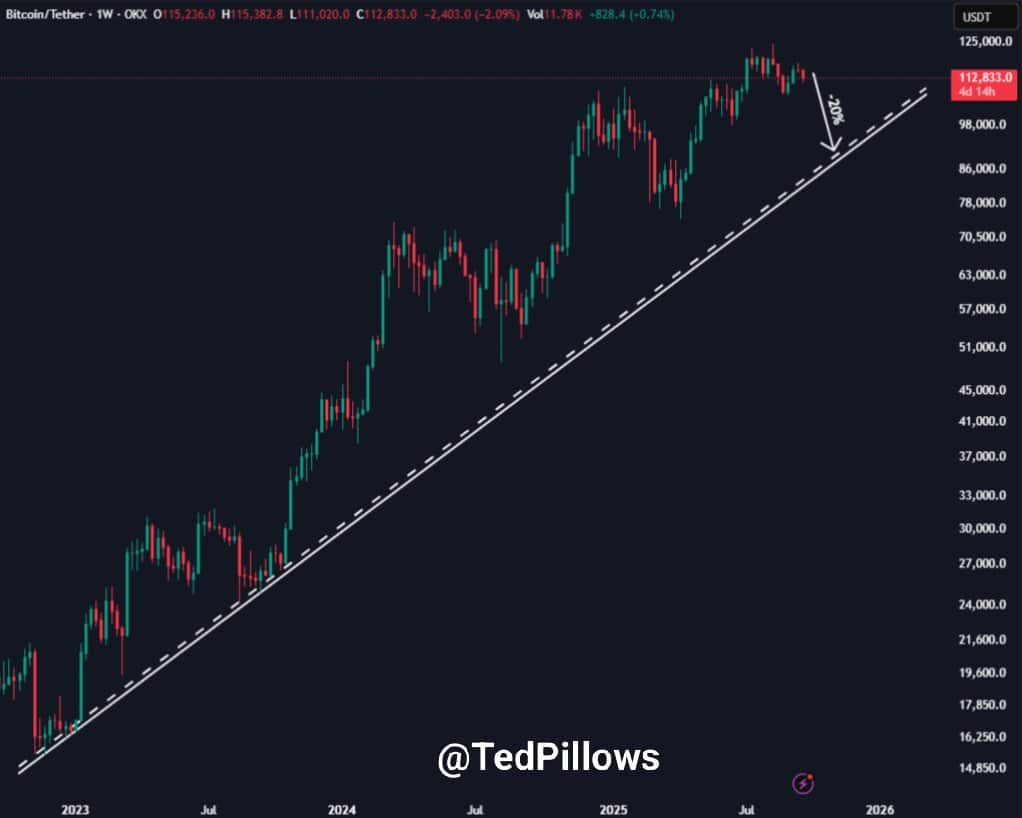
Analyst Ted Pillows posted a weekly view that highlights Bitcoin’s long-term ascending trendline. It has acted as support since early 2023, with the market bouncing from it on multiple occasions. Pillows called it “the most important trendline for $BTC.”
The trendline currently runs through the $90,000–$92,000 area. The analyst added that this range also matches an open CME gap, making it an area to watch. His chart suggests that if the price drops by about 20%, it could retest this level before a larger rally.
A recent report from CryptoPotato, citing Santiment data, showed that Binance traders reached their highest level of short exposure in over three months just before Bitcoin’s latest red candle. Soon after, many of those positions flipped back to the long side as price momentum shifted.
In fact, the combination of repeating cycle patterns, support tests, and high futures activity has kept attention on whether BTC is preparing for another expansion phase.
The post Bitcoin’s Cup & Handle Playbook Points to Explosive Expansion appeared first on CryptoPotato.
