

Bitcoin is trading around $112K after showing signs of recovery from recent dips. The charts highlight a potential shift in structure, but on-chain activity reveals a concerning slowdown in network usage, which could weigh on the sustainability of bullish momentum.
By Shayan
The Daily Chart
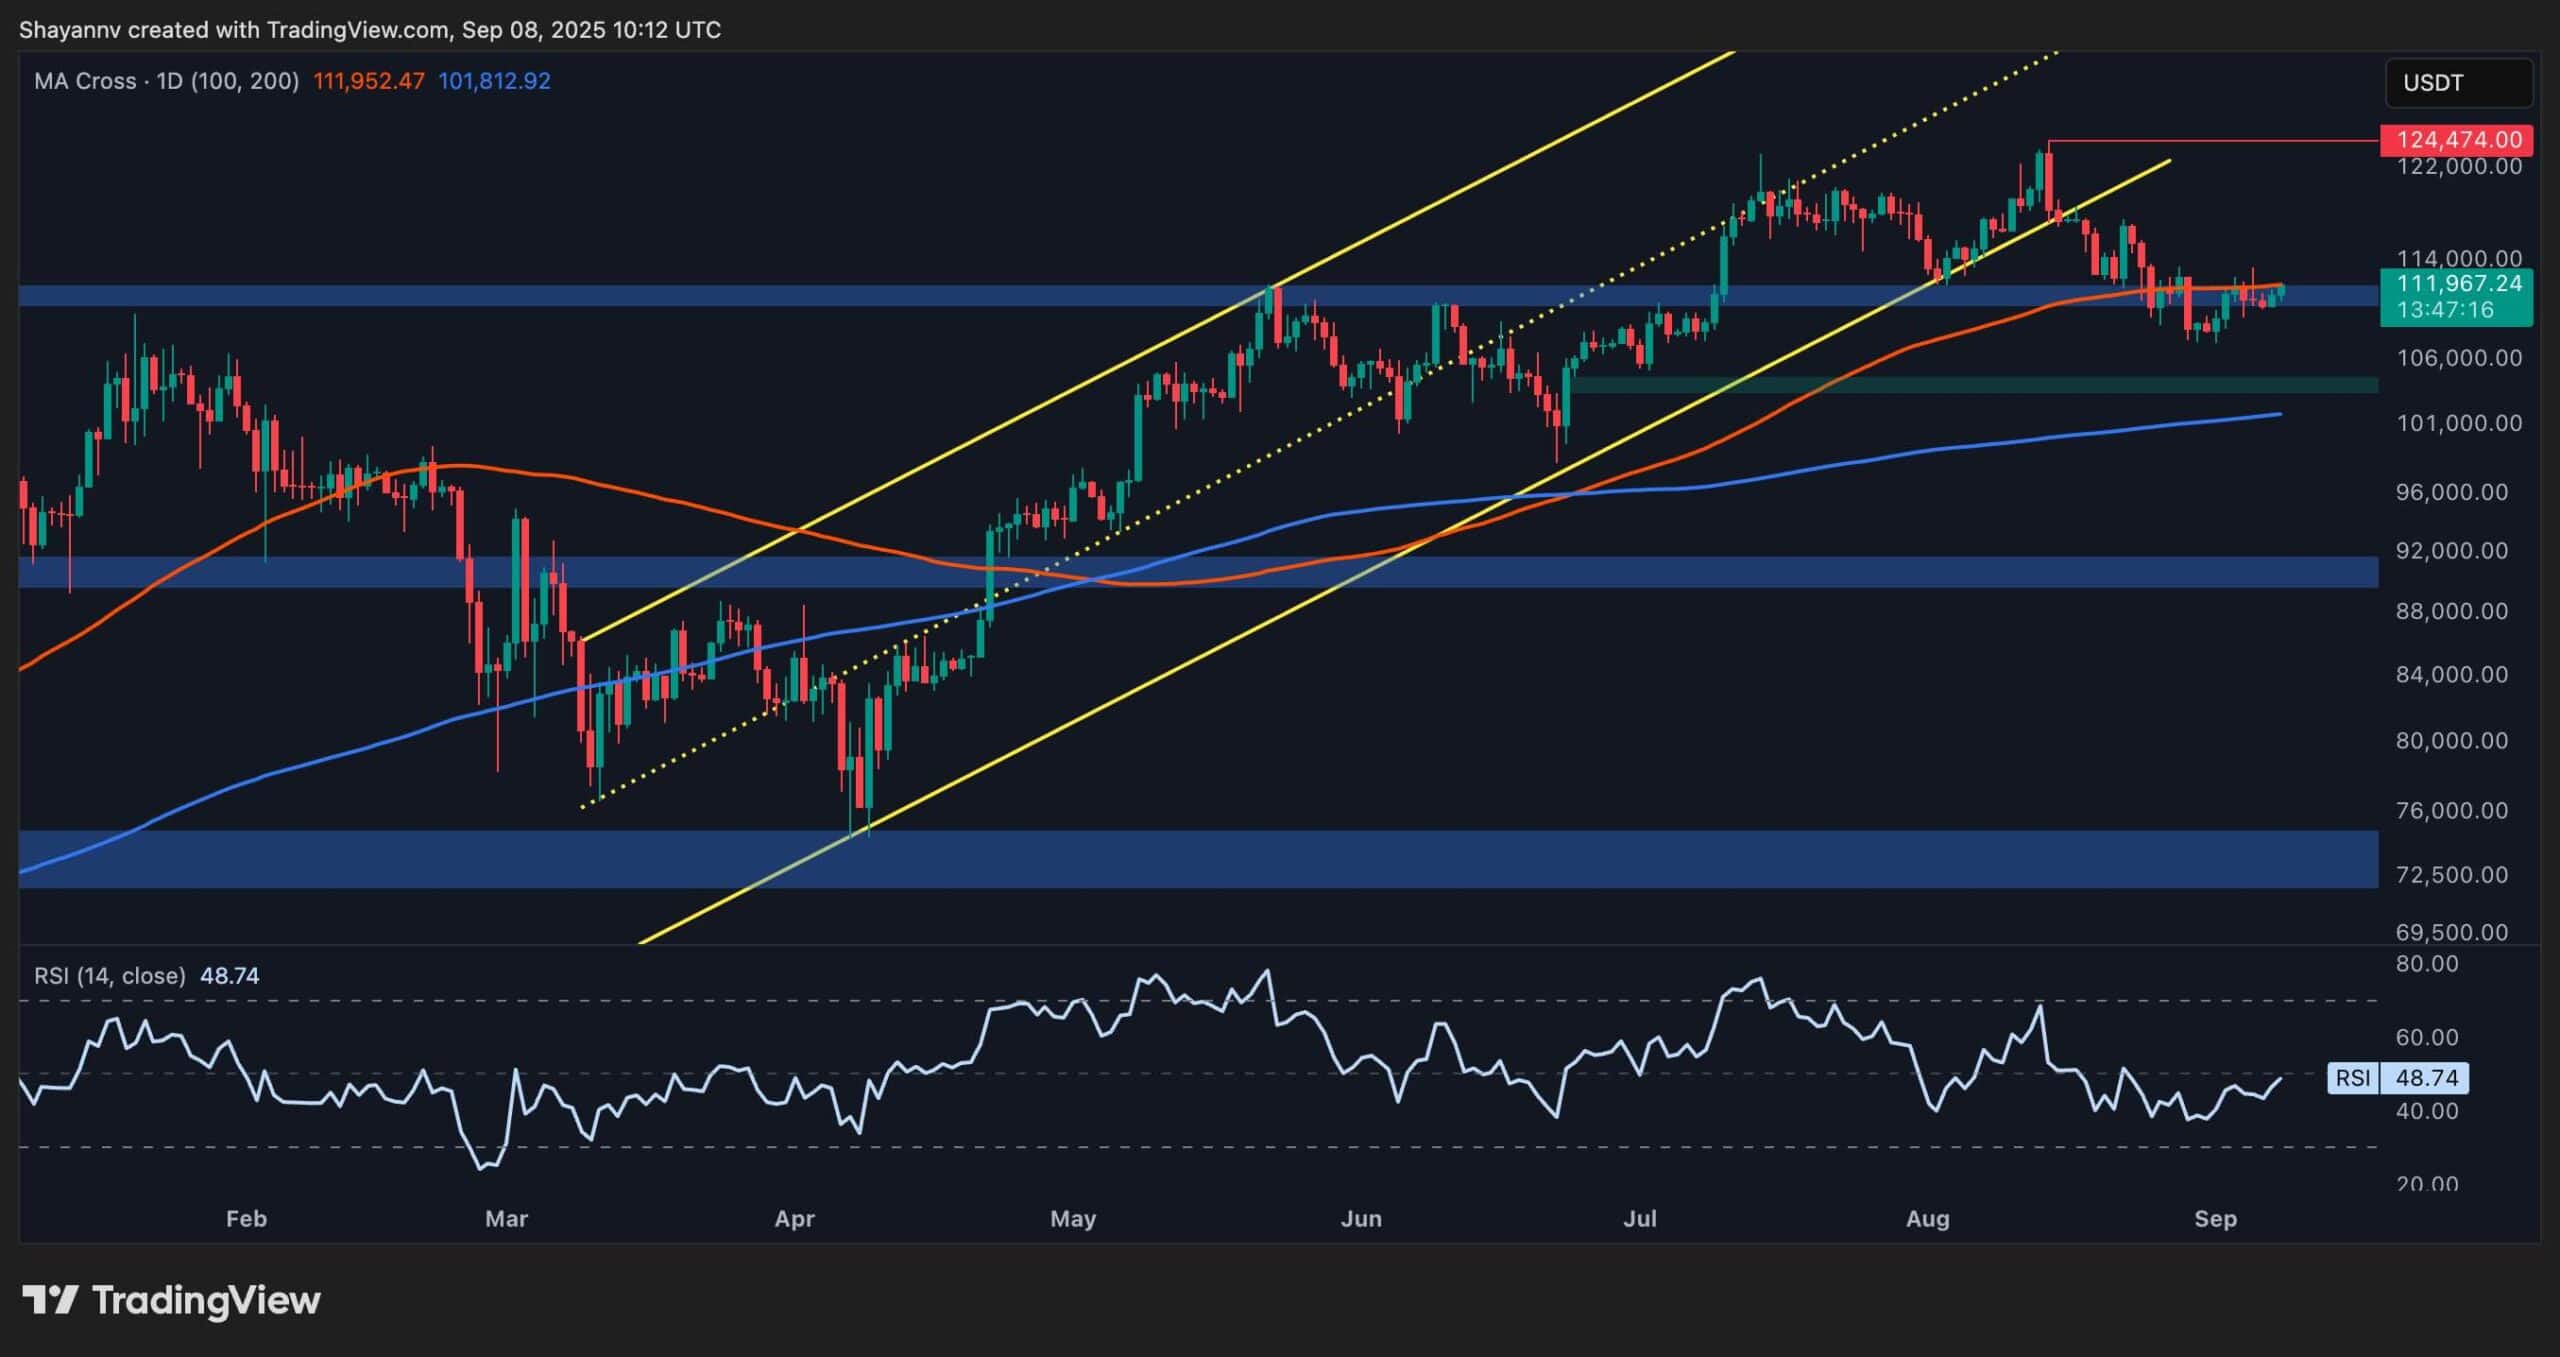
On the daily chart, BTC is retesting the $112K level after bouncing from the $107K support zone. The price is currently sitting just under the 100-day moving average, which has turned into short-term resistance. The RSI remains weak near 48, suggesting that buyers are present but lack strong conviction.
For now, the $110K area remains the key pivot. If it holds, Bitcoin could aim for $116K and eventually the $124K high. But failure to stay above this zone risks dragging the price back toward $104K, where a larger pool of demand lies.
The 4-Hour Chart
The 4-hour chart shows a double-bottom pattern forming around $106K, which has triggered a bounce back toward the $112K neckline zone. RSI has climbed toward 59, reflecting stronger short-term momentum as buyers attempt to regain control.
If bulls can break above $112K with volume, the next target is the $117K supply zone. However, repeated rejections here would weaken the structure and possibly push price back toward the $110K region, making it another battleground for short-term traders.

Onchain Analysis
Active Addresses
Despite the price stability, active addresses have been trending downward for months and show no signs of meaningful recovery. This decline suggests that retail participation and organic network demand are fading. Fewer active users often indicate that short-term speculation dominates the market, while real adoption and usage slow down.
Behind the scenes, this trend could be explained by several factors: first, increased institutional dominance, where Bitcoin is treated more as a tradable asset than a medium of exchange; second, retail users shifting toward altcoins, DeFi, or stablecoins; and finally, long-term holders moving coins into cold storage, reducing transactional activity on-chain.
This divergence between price strength and weak address activity signals that liquidity is thinner, making BTC more vulnerable to volatility spikes if demand doesn’t return.

The post Bitcoin Price Analysis: Crucial Resistance Could Unlock Record Highs appeared first on CryptoPotato.
