Tuesday, November 18, 2025

Advertise

spot_img
Home Blog Page 3

Crypto Market Wipes Out $1 Trillion Since October: Analyzing The Forces Behind The Crash

0

Since October 6, the crypto market has lost over $1.1 trillion in value. Analysts from The Bull Theory examined the underlying causes of this behavior and identified significant issues causing such poor performance in what was expected to be a bullish fourth quarter for the industry.

Market Liquidity Stumbles Post-October 10 Sell-Off

One of the primary factors cited is the severe damage inflicted on market liquidity following the dramatic sell-off on October 10, which resulted in more than $20 billion liquidated from traders in a matter of minutes. 

This particularly impacted altcoins, with many seeing losses of 70% to 80%. With liquidity diminished, the current market environment allows prices to fluctuate easily, meaning even minor sell-offs can lead to rapid price drops. 

The analysts noted that the liquidity has failed to recover since this initial dump, resulting in the order books for major cryptocurrencies such as Bitcoin (BTC) and Ethereum (ETH) becoming increasingly sparse.

The consequences of this thin liquidity are stark; a small volume of selling can generate significant downward price movements. This observation matches the reality of recent market activity, where price declines appear more pronounced than the actual selling volume.

Another contributing factor to the downturn, as pointed out by market analyst Tom Lee, is the behavior of major market makers. According to Lee, the ongoing correction may stem from one or two large entities facing considerable losses. 

Layered upon these issues is the excessive leverage in the market. Despite the unprecedented liquidations, many traders have reportedly returned to the market with increased leverage. 

The Bull Theory analysts contend that this high leverage, coupled with thin markets, enables market makers to trigger substantial liquidations with minimal price movement, making the sell-offs appear more aggressive.

Crypto Fear Index Hits Lowest Level In Over 3 Years

Compounding these issues, market sentiment has been plagued by fear, uncertainty, and doubt (FUD). Current narratives circulating, such as speculation regarding Strategy (previously MicroStrategy) facing forced liquidations if Bitcoin falls below $74,000, further exacerbate panic. 

It is worth noting that during the 2020-2021 cycle, Strategy’s cost basis hovered around $30,000 to $32,000. Even when Bitcoin dipped to $16,000—almost 50% below their cost—the company did not sell any coins. 

The Fear Index has also plummeted to 10, a level not seen in over three and a half years. The analysts belive that such extreme fear suggests two potential scenarios: either the market has reached its bottom, or it is approaching it. 

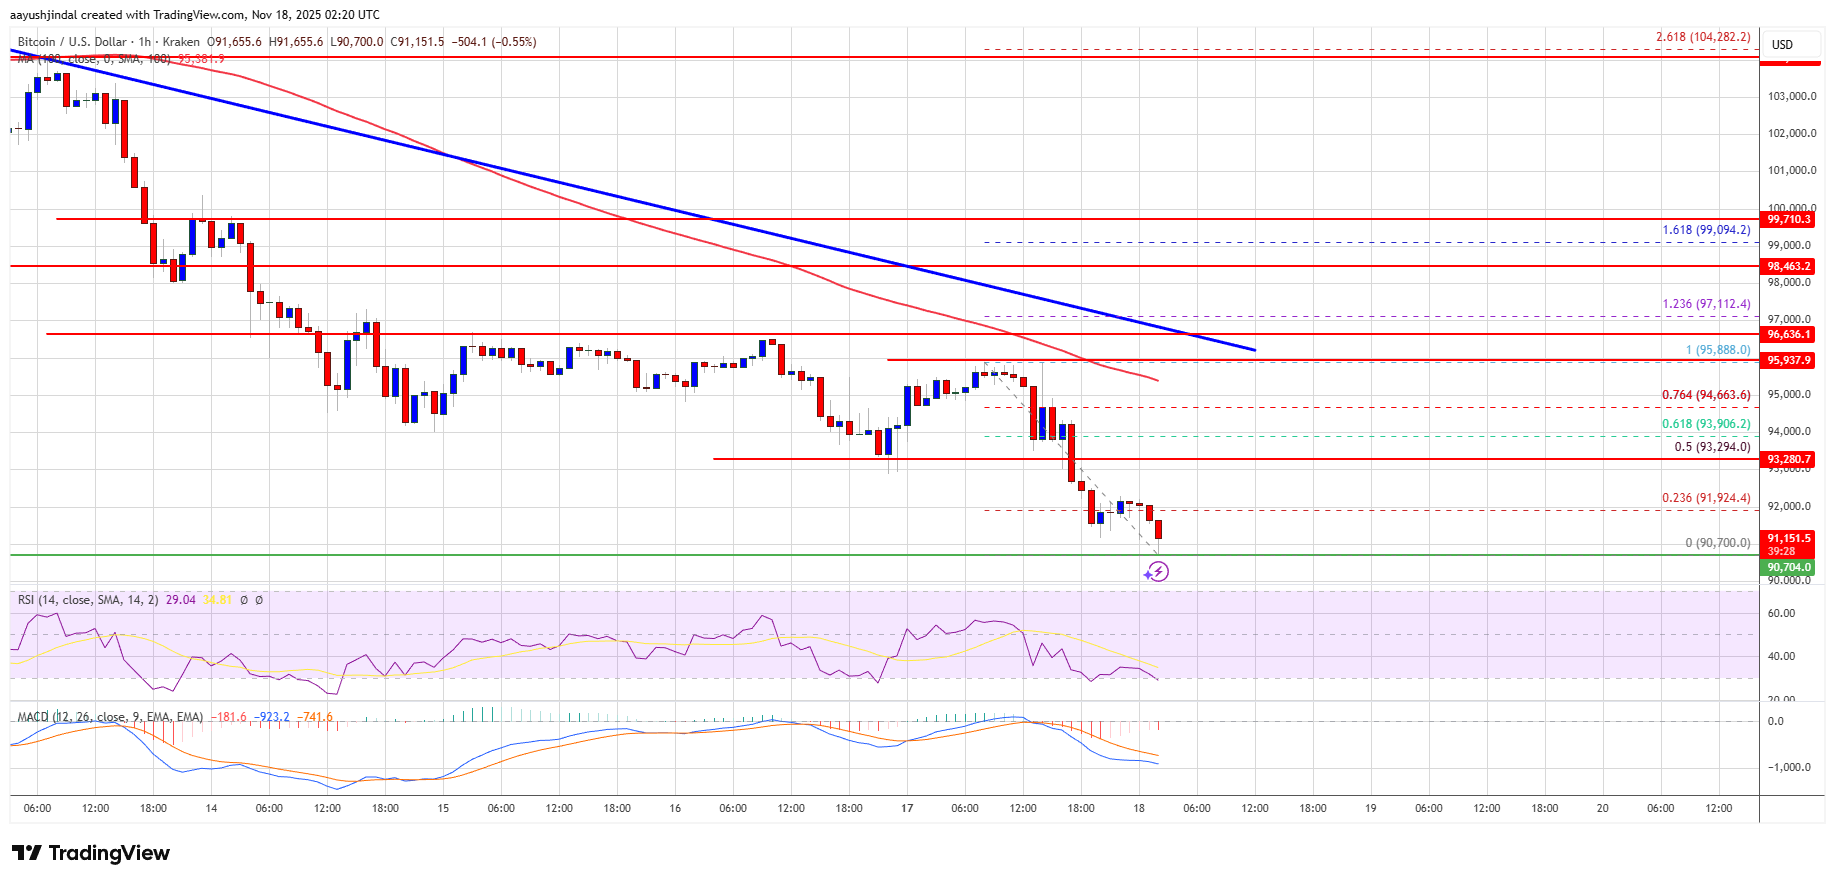
In conjunction with these sentiment measures, the Relative Strength Index (RSI) for Bitcoin has returned to levels comparable to those of January 2023, when Bitcoin was valued around $20,000. 

The analysts suggest that this signals a stretched market on the downside, particularly within altcoins, where speculative activity has diminished and retail interest is waning.

Despite the current turmoil, the Bull Theory analysts find that fundamentally, little has changed within the crypto market. They highlighted that Bitcoin’s network remains robust, with increasing hashrate, ongoing institutional interest, and a supportive stance from the US government regarding regulated crypto.

However, it remains to be seen what the eventual direction of the digital asset market will be, as neither negative nor bullish cycles follow straight lines. This suggests that despite the downtrend, a new recovery and future dips may occur, and vice versa. 

Crypto

At the time of writing, Bitcoin was leading Monday’s crypto market drop, trading at $91,940—a 3% drop within 24 hours and a 13% drop within a week. 

Featured image from DALL-E, chart from TradingView.com 

Solana (SOL) Extends Sell-Off to $130 as Recovery Attempts Remain Fragile

0

Solana started a fresh decline below the $145 zone. SOL price is now consolidating losses below $140 and might decline further below $130.

  • SOL price started a fresh decline below $145 and $140 against the US Dollar.
  • The price is now trading below $140 and the 100-hourly simple moving average.
  • There is a key bearish trend line forming with resistance at $136 on the hourly chart of the SOL/USD pair (data source from Kraken).
  • The price could start a recovery wave if the bulls defend $130 or $128.

Solana Price Dips Further

Solana price failed to remain stable above $155 and started a fresh decline, like Bitcoin and Ethereum. SOL declined below the $150 and $140 support levels.

The price gained bearish momentum below $138. A low was formed at $128, and the price is now consolidating losses. The price recovered a few points above the 23.6% Fib retracement level of the downward move from the $143 swing high to the $128 low.

Solana is now trading below $140 and the 100-hourly simple moving average. On the upside, immediate resistance is near the $136 level. There is also a key bearish trend line forming with resistance at $136 on the hourly chart of the SOL/USD pair.

Solana Price

The next major resistance is near the $140 level or the 76.4% Fib retracement level of the downward move from the $143 swing high to the $128 low. The main resistance could be $142. A successful close above the $142 resistance zone could set the pace for another steady increase. The next key resistance is $150. Any more gains might send the price toward the $155 level.

Another Decline In SOL?

If SOL fails to rise above the $140 resistance, it could continue to move down. Initial support on the downside is near the $130 zone. The first major support is near the $128 level.

A break below the $128 level might send the price toward the $120 support zone. If there is a close below the $120 support, the price could decline toward the $108 support in the near term.

Technical Indicators

Hourly MACD – The MACD for SOL/USD is gaining pace in the bearish zone.

Hourly Hours RSI (Relative Strength Index) – The RSI for SOL/USD is below the 50 level.

Major Support Levels – $130 and $128.

Major Resistance Levels – $136 and $140.

Analyst Shares Worst-Case Scenario For Bitcoin (BTC) As Price Shows Concerning Signs

0

While Bitcoin (BTC) continues to lose crucial support levels, an analyst has shared three possible scenarios for the flagship crypto’s upcoming performance, raising the alarm about potential early signs of a bear market.

Bitcoin Price Correction Continues

On Monday, Bitcoin reached a new multi-month low after dropping below $93,000 for the first time since May. The cryptocurrency started the week dropping nearly 5% from the $96,000 area and retesting the $91,000 level as support.

Notably, BTC has seen a 16% correction from its November opening and has lost multiple crucial levels over the past few weeks, including the $100,000 psychological barrier and the 21-Week Exponential Moving Average (EMA) as support.

Most recently, the flagship cryptocurrency closed the week below the 50-week EMA, which has raised the alarm for several market observers.

Analyst Rekt Capital noted that losing this indicator is “not something we typically want to see if bullish Market Structure is to remain intact,” adding that “bear markets tend to confirm when price loses the key bullish levels that have supported upside momentum across the cycle.”

bitcoin

He explained that Bitcoin has formed clusters of lower lows at the 50-Week EMA across the cycle, which have “helped sustain a broader bullish technical uptrend.” However, BTC is currently forming another cluster below this indicator, instead of approaching the possible macro lower high developing above the 50-Week EMA.

As a result, BTC’s recent performance signals the first step of a potential breakdown, the analyst warned:

A full breakdown unfolds in three parts: first, a Weekly Close below the key level; second, a post-breakdown relief rally that turns that level into new resistance; and third, downside continuation that completes the bearish confirmation.

Early Signs Of A Bearish Trend?

Rekt Capital stressed that the 50-week EMA will be crucial in determining whether BTC’s bullish trend and tendency for “benign downside deviations” still hold.

He emphasized that if the flagship crypto fails to reclaim this indicator as support and it turns into a resistance, it could be transitioning from its downside deviation tendency to the early stages of a confirmed bearish trend.

The analyst detailed that during the early bear markets, “a Weekly Close below the 50-Week EMA is followed by several weeks of post-breakdown relief rallies into that moving average, but those attempts ultimately fail, and the EMA simply acts as resistance until downside acceleration unfolds.”

Based on this, he shared three potential outlooks for BTC’s performance. The best-case scenario for Bitcoin would be reclaiming this indicator and successfully ending this correction as a downside deviation, as it would suggest that BTC remains in a bull market.

The second-best case scenario would be that Bitcoin sees a multi-week hesitation period below the EMA as it enters the bear market, which could include a brief overextension above this level before a clearer trend resolution to the downside.

Meanwhile, the worst-case scenario would see the cryptocurrency’s price unable to retest the 50-Week EMA, even as resistance, and directly enter the downside acceleration phase.

Nonetheless, the analyst noted that, historically, the third scenario doesn’t appear as likely if we have already entered a bear market. Instead, he concluded that the recurring “relief-rally scenario” into the 50-week EMA before downside continuation seems more likely.

bitcoin, btc, btcusdt

Breaking: Solana ETFs by Fidelity and Canary Marinade to Launch on Tuesday

0

Bloomberg ETF analysts confirm Fidelity Solana ETF (FSOL) and Canary Marinade Solana ETF (SOLC) to launch on Tuesday. With the launch, the crypto industry will have five spot Solana ETFs to trade, but SOL price dips despite inflows in SOL exchange-traded funds. Fidelity Solana ETF (FSOL) to Start Trading on NYSE Arca Today Fidelity Solana

The post Breaking: Solana ETFs by Fidelity and Canary Marinade to Launch on Tuesday appeared first on CoinGape.

Bitcoin Bleeds $1.38B as Traders Rush Into Bearish Bets, Ethereum Hit Even Harder

0

Digital asset investment products saw $2 billion exit the market last week in the biggest outflows since February. It was also the third consecutive week of negative flows, which pushed the combined total to $3.2 billion. CoinShares attributed the downturn to ongoing monetary policy uncertainty in addition to selling activity from major crypto whales.

Falling prices have further weighed on the sector, causing the total assets under management in digital-asset ETPs to slide by almost 27% from their early-October peak of $264 billion to $191 billion.

Digital Asset Exodus

In the latest edition of the Digital Asset Fund Flows Weekly Report, CoinShares reported that Bitcoin was hit hardest by last week’s negative sentiment and recorded $1.38 billion in outflows, while extending its three-week streak and now accounting for 2% of total assets under management (AuM). At the same time, short Bitcoin products attracted $9.1 million in inflows over the past week, which indicates that some traders are positioning for further downside. Zooming out, these ETPs have seen $18.1 million in new inflows over the past three weeks.

Ethereum performed even worse and witnessed $689 million in outflows, equal to 4% of its AuM. Solana and XRP also posted small outflows of $8.3 million and $15.5 million, respectively. On the other hand, Sui, Litecoin, and Cardano saw modest inflows of $6 million, $3.3 million, and $0.4 million.

Multi-asset investment products also drew $31.2 million in new capital. In fact, cautious market conditions pushed investors toward these diversified products, which resulted in $69 million flowing into multi-asset ETPs over the past three weeks.

Negative sentiment hit most regions, and was led overwhelmingly by the US, which recorded $1.97 billion in outflows, or 97% of the global total. Several other markets also saw similar outflows, including Switzerland with $39.9 million, Sweden with $1.3 million, and Hong Kong with $12.3 million. Canada and Australia followed suit with $9.8 million and $1.8 million in outflows.

On the other hand, Germany stood out as the only major region to take advantage of the price pullback, while attracting $13.2 million in inflows. Brazil also bucked the trend and registered a more modest $2.4 million in new capital.

Sentiment Cautious But Constructive

Despite the current struggles, certain market experts believe that Bitcoin is in the later stages of its correction rather than entering a new downtrend. In a statement to CryptoPotato, Zilliqa’s Interim CEO Alexander Zahnd explained that the market twice rejected levels just below $100,000, which means that forced selling has mostly cleared, and buyers are quietly defending a key support zone.

While it is too early to confirm a bottom, he said the market is stabilising. The exec added that recent bearish sentiment is being driven by ETF outflows, thinner liquidity, and a temporary pause in institutional allocation, none of which indicate a structural shift. Instead, investors are waiting for clearer macro signals after the Fed’s recent pause and US shutdown concerns. He described the overall sentiment as “cautious but constructive.”

Zahnd went on to add,

“Positioning has lightened, but we’re not seeing panic. The rotation into ecosystems like Solana shows that capital is still active, just more selective. This phase is about rebuilding pressure, not chasing momentum. If anything, the current environment favours gradual accumulation on support rather than trying to time dramatic moves. The next impulse will likely come once ETF flows stabilise or new institutional buyers step back in.”

The post Bitcoin Bleeds $1.38B as Traders Rush Into Bearish Bets, Ethereum Hit Even Harder appeared first on CryptoPotato.

XRP Price Slips Toward $2.00, Increasing Pressure on Short-Term Support Levels

0

XRP price started a fresh decline from $2.250. The price is now showing bearish signs and might extend losses if it dips below $2.120.

  • XRP price started a fresh decline below the $2.250 zone.
  • The price is now trading below $2.20 and the 100-hourly Simple Moving Average.
  • There is a bearish trend line forming with resistance at $2.220 on the hourly chart of the XRP/USD pair (data source from Kraken).
  • The pair could continue to move down if it settles below $2.120.

XRP Price Dips Further

XRP price attempted a recovery wave above $2.30 but failed to continue higher, like Bitcoin and Ethereum. The price started a fresh decline below $2.250 and $2.20.

There was a move below the $2.150 support level. A low was formed at $2.105, and the price is now consolidating losses with a bearish angle below the 23.6% Fib retracement level of the downward move from the $2.525 swing high to the $2.058 low.

The price is now trading below $2.20 and the 100-hourly Simple Moving Average. If there is a fresh upward move, the price might face resistance near the $2.20 level. The first major resistance is near the $2.220 level. There is also a bearish trend line forming with resistance at $2.220 on the hourly chart of the XRP/USD pair.

XRP Price

A close above the trend line could send the price to $2.28. The next hurdle sits at $2.320 or the 50% Fib retracement level of the downward move from the $2.525 swing high to the $2.058 low. A clear move above the $2.320 resistance might send the price toward the $2.40 resistance. Any more gains might send the price toward the $2.450 resistance. The next major hurdle for the bulls might be near $2.50.

Another Drop?

If XRP fails to clear the $2.220 resistance zone, it could start a fresh decline. Initial support on the downside is near the $2.120 level. The next major support is near the $2.10 level.

If there is a downside break and a close below the $2.10 level, the price might continue to decline toward $2.050. The next major support sits near the $2.020 zone, below which the price could continue lower toward $1.880.

Technical Indicators

Hourly MACD – The MACD for XRP/USD is now gaining pace in the bearish zone.

Hourly RSI (Relative Strength Index) – The RSI for XRP/USD is now below the 50 level.

Major Support Levels – $2.120 and $2.050.

Major Resistance Levels – $2.20 and $2.220.

Bitcoin Price Alert: This Indicator Signals SELL, Could History Repeat With A 67% Drop?

0

The Bitcoin price has seen a significant pullback, retracing nearly 26% from its all-time highs, fueling speculation about the potential onset of a new bear market. 

Compounding this uncertainty, a fresh sell signal has emerged from one of the cryptocurrency’s key indicators, reminiscent of the past when similar signals led to a staggering 67% drop in value.

Bitcoin Price Could Plunge To $31,000

Market expert Ali Martinez pointed out in a recent post on social media platform X (formerly Twitter) that the last time the SuperTrend indicator issued a sell signal for Bitcoin was in 2022. At that time, Bitcoin, which had reached an all-time high of $69,000, subsequently fell to around $17,000. 

While the market landscape has changed significantly since then—with the introduction of exchange-traded funds (ETFs), new digital asset treasuries (DATs), and increased institutional support spurred by pro-crypto regulations—the current situation mirrors some of those past concerns.

Bitcoin price

As it stands, the Bitcoin price is trading just above $94,500. If the historical trend of a 67% retracement were to repeat in the next months, the price could potentially fall to around $31,185, which could be the potential bottom of the new bear market. 

Adding to the conversation, another analyst known as Mr. Wall Street suggested that the recent Bitcoin price peak might be at $126,000. He forecasted that the next major downward move could see BTC hit levels between $74,000 and $82,000, ultimately reaching a target between $54,000 and $60,000 by the fourth quarter of 2026. 

This perspective contributes to the notion that Bitcoin is likely confirmed in a bear market, which could result in a year-long decline marked by price fluctuations similar to those seen in previous bear cycles.

A New Death Cross Emerges

Further complicating the outlook, analyst Doctor Profit pointed out a significant technical signal: the Bitcoin price experienced a death cross for the first time since April 2025. 

This event, marked by the 50-day moving average (MA) crossing below the 200-day moving average, historically led to rallies of 25% to 60% in the following three months. 

However, Doctor Profit emphasized a crucial difference this time around: the death cross occurred while Bitcoin was trading 6% below the 50-day exponential moving average (EMA50). In the previous instances, such crosses happened while Bitcoin was positioned above the EMA50, suggesting a different market sentiment this time.

The current bearish sentiment is intensified by negative trends in ETF sales and whale net volume, adding significant pressure to the Bitcoin price. 

With the average entry price for Bitcoin buyers over the past six months set at approximately $94,600, falling back toward or below this level could trigger fresh selling pressure. 

Historically, short-term traders tend to exit at breakeven or even at a slight loss, raising concerns about further declines. Doctor Profit concluded his analysis stating: 

This combination of ETF selling, whale selling, and a large cluster of sellers sitting at breakeven levels is a dangerous setup and adds to the bearish case. 

Bitcoin price

Featured image from DALL-E, chart from TradingView.com 

Ethereum Breaks $3K Floor as Bears Press for Additional Downside

0

Ethereum price failed to stay above $3,150 and extended losses. ETH is down over 5% and might struggle to recover above $3,200 in the near term.

  • Ethereum started a fresh decline after it failed to stay above $3,150.
  • The price is trading below $3,100 and the 100-hourly Simple Moving Average.
  • There is a key bearish trend line forming with resistance at $3,150 on the hourly chart of ETH/USD (data feed via Kraken).
  • The pair could continue to move down if it settles below the $3,000 zone.

Ethereum Price Turns Red

Ethereum price failed to continue higher above $3,150 and started a fresh decline, like Bitcoin. ETH price dipped below $3,180 and entered a bearish zone.

The decline gathered pace below $3,120 and the price dipped below $3,000. A low was formed at $2,955 and the price is now correcting some losses. There was a move toward the 23.6% Fib retracement level of the recent decline from the $3,562 swing high to the $2,955 low.

Ethereum price is now trading below $3,150 and the 100-hourly Simple Moving Average. If there is another recovery wave, the price could face resistance near the $3,050 level. The next key resistance is near the $3,150 level. There is also a key bearish trend line forming with resistance at $3,150 on the hourly chart of ETH/USD.

Ethereum Price

The first major resistance is near the $3,260 level and the 50% Fib retracement level of the recent decline from the $3,562 swing high to the $2,955 low. A clear move above the $3,260 resistance might send the price toward the $3,350 resistance. An upside break above the $3,350 region might call for more gains in the coming days. In the stated case, Ether could rise toward the $3,450 resistance zone or even $3,500 in the near term.

More Downside In ETH?

If Ethereum fails to clear the $3,150 resistance, it could start a fresh decline. Initial support on the downside is near the $2,950 level. The first major support sits near the $2,880 zone.

A clear move below the $2,880 support might push the price toward the $2,750 support. Any more losses might send the price toward the $2,680 region in the near term. The next key support sits at $2,650 and $2,640.

Technical Indicators

Hourly MACDThe MACD for ETH/USD is gaining momentum in the bearish zone.

Hourly RSIThe RSI for ETH/USD is now below the 50 zone.

Major Support Level – $2,950

Major Resistance Level – $3,150

Bitcoin SSR Flashes Buy Signal: Rebound Incoming?

0

On-chain data shows the Bitcoin Stablecoin Supply Ratio has declined into the buy territory. Here’s what followed this signal in the past.

Bitcoin SSR RSI Is Giving A Buy Signal

In a new post on X, CryptoQuant community analyst Maartunn has talked about the latest trend in the Stablecoin Supply Ratio (SSR) for Bitcoin. The SSR is an indicator that measures how the market cap of BTC compares against the total supply of the stablecoins.

Stablecoins refer to cryptocurrencies that are pegged to a fiat currency. Investors generally park their capital in the form of these assets when they want to avoid the volatility associated with BTC and other assets.

Such holders also usually eventually invest back into Bitcoin and company, however, exchanging away their stablecoins in favor of them once they feel the time is right. Because of this reason, the stablecoin supply is often looked at as a sort of “available buy supply” in the cryptocurrency sector.

When the value of SSR is high, it means BTC’s value is high compared to the stablecoin supply. Such a trend suggests the market stablecoin buying power is low, which could be a bearish sign.

On the other hand, the indicator being low implies the sector may have a high amount of dry powder available relative to the Bitcoin market cap, which can naturally be bullish.

Now, here is the chart for the BTC SSR shared by the analyst that shows the trend in its Relative Strength Index (RSI) over the last couple of years:

Bitcoin SSR

As is visible in the above graph, the Bitcoin SSR RSI has witnessed a decline recently as the BTC spot price has crashed. This suggests that there may be a high amount of stablecoin buying power available in the market now.

The indicator’s drop has been so steep that it has entered into a zone that Maartunn has flagged as pertaining to a buy signal. From the chart, it’s apparent that past instances of this signal have often coincided with some sort of bottom or led into a price surge.

In a lot of the instances, however, the signal has only resulted in a temporary reversal. It now remains to be seen whether any bullish shift will follow the latest signal, and if one does, whether it will be lasting.

In some other news, a large movement involving dormant tokens has just occurred on the Bitcoin network, as Maartunn has pointed out in another X post.

Bitcoin SOAB

“4,668 $BTC aged 3–5 years were just spent — a clear spike in dormant supply activation,” noted the analyst. Movement from dormant hands is often a sign of selling.

BTC Price

Bearish momentum hasn’t shown any signs of stopping for Bitcoin as its price has now dropped to the $92,500 level.

Bitcoin Price Chart

Bitcoin Continues Lower, Raising Fears That $90K Support May Not Hold

0

Bitcoin price failed to recover above $95,000. BTC is down over 4% and there are chances of more downsides below $90,000.

  • Bitcoin started a fresh decline below $94,000 and $93,500.
  • The price is trading below $93,000 and the 100 hourly Simple moving average.
  • There is a bearish trend line forming with resistance at $95,850 on the hourly chart of the BTC/USD pair (data feed from Kraken).
  • The pair might continue to move down if it settles below the $91,500 zone.

Bitcoin Price Continues To Weaken

Bitcoin price failed to stay in a positive zone above the $93,500 pivot level. BTC bears remained active below $93,500 and pushed the price lower.

The bears gained strength and were able to push the price below the $92,000 zone. A low was formed at $90,700 and the price is now showing bearish signs below the 23.6% Fib retracement level of the recent decline from the $95,888 swing high to the $90,700 low.

Bitcoin is now trading below $92,000 and the 100 hourly Simple moving average. Besides, there is a bearish trend line forming with resistance at $95,850 on the hourly chart of the BTC/USD pair.

If the bulls attempt another recovery wave, the price could face resistance near the $92,500 level. The first key resistance is near the $93,250 level and the 50% Fib retracement level of the recent decline from the $95,888 swing high to the $90,700 low.

Bitcoin Price

The next resistance could be $93,800. A close above the $93,800 resistance might send the price further higher. In the stated case, the price could rise and test the $94,500 resistance. Any more gains might send the price toward the $95,500 level. The next barrier for the bulls could be $95,800 and $96,500.

More Losses In BTC?

If Bitcoin fails to rise above the $93,500 resistance zone, it could start another decline. Immediate support is near the $90,800 level. The first major support is near the $90,500 level.

The next support is now near the $90,000 zone. Any more losses might send the price toward the $88,000 support in the near term. The main support sits at $86,500, below which BTC might accelerate lower in the near term.

Technical indicators:

Hourly MACD – The MACD is now gaining pace in the bearish zone.

Hourly RSI (Relative Strength Index) – The RSI for BTC/USD is now below the 50 level.

Major Support Levels – $90,500, followed by $90,000.

Major Resistance Levels – $92,500 and $95,800.

Translate »