Thursday, November 27, 2025

Advertise

spot_img
Home Blog Page 1049

Bitcoin Sees $3 Billion Daily Growth in Realized Cap Amid Ongoing Accumulation

0

The broader cryptocurrency market has been on an upward trajectory over the past few weeks, partly driven by improving global macroeconomic conditions. Recent policy shifts between the United States and China, two of the worldโ€™s largest economies, have helped fuel investor sentiment.

Both countries have agreed to temporarily reduce tariffs: the US cut rates from 145% to 30%, while China lowered its own from 125% to 10%, each over 90 days. These decisions have been interpreted by some as a step toward easing global trade tensions, supporting risk-on assets such as Bitcoin.

In response to the broader bullish environment, Bitcoin has seen a steady rise, currently trading at $106,574, up 1.7% in the last 24 hours. The price earlier reached a 24-hour high of $107,844 before retreating slightly.

Despite the pullback, Bitcoin remains just 2% below its all-time high of $109,000, recorded in January 2025. The consistent climb has led analysts and traders to monitor on-chain metrics more closely to gauge market behavior and possible future movements.

Realized Capitalization Surges as Accumulation Phase Strengthens

A recent analysis from CryptoQuant contributor Carmelo Alemรกn has brought attention to Bitcoinโ€™s realized capitalization, a metric that measures the total value of Bitcoin based on the price at which each coin last moved on-chain.

According to Alemรกn, the realized cap jumped by more than $3 billion in a single day, marking a 0.33% increase in the total capital invested in Bitcoin. This significant uptick signals renewed capital inflows, and more importantly, it points to a recurring pattern of accumulation and consolidation.
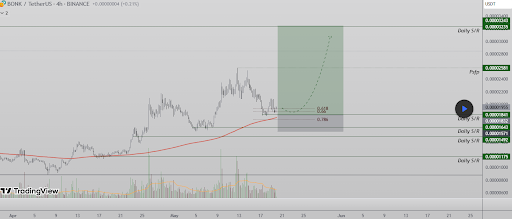
Alemรกn identified a repeating cycle beginning in April, where Bitcoin has shown sharp price increases followed by sideways movements lasting 8 to 10 days. These lateral phases, supported by rising realized cap, form a staircase-like chart structure with each step building upon the previous one.

Bitcoin realized cap

From an on-chain perspective, the steady climb in realized cap suggests buyers are entering the market at higher levels, lifting the networkโ€™s aggregate cost basis and demonstrating long-term confidence in the asset.

On-Chain Trends Suggest Investors Are Positioning for Continuation

Alemรกn also highlighted that the behavior of realized capitalization in the current market mirrors patterns seen in previous bull cycles. Historically, spikes in this metric during consolidation phases have preceded large-scale price movements.

The current rise indicates that capital entering the market is doing so with a long-term view, rather than speculative short-term intent. This positions the market for a potential continuation, especially as accumulation appears to intensify around the psychological $106,000โ€“$109,000 range.

The analyst concluded that tracking realized cap in the days ahead will be essential to confirm whether the current phase evolves into another upward price impulse. If the trend persists, it could support another leg higher, reinforcing the view that Bitcoin remains in a broader accumulation structure.

Bitcoin (BTC) price chart on TradingView

Featured image created with DALL-E, Chart from TradingView

Ethereum Price Could Surge to $3K Soon โ€” Riding The Wave of Bitcoinโ€™s Strength

0

Ethereum price found support at $2,440 and started a fresh increase. ETH is now rising and might aim for a move above the $2,650 resistance zone.

  • Ethereum started a decent increase above the $2,500 and $2,520 levels.
  • The price is trading above $2,540 and the 100-hourly Simple Moving Average.
  • There is a connecting bullish trend line forming with support at $2,500 on the hourly chart of ETH/USD (data feed via Kraken).
  • The pair could gain strength if it clears the $2,620 resistance in the near term.

Ethereum Price Could Gain Strength

Ethereum price remained in a range above $2,350 while Bitcoin traded to a new all-time high. ETH bulls were active near the $2,440 zone. A low was formed at $2,442 and the price started a fresh increase.

There was a move above the $2,500 and $2,520 levels. The price surpassed the 50% Fib retracement level of the downward wave from the $2,615 swing high to the $2,442 low. Besides, there is a connecting bullish trend line forming with support at $2,500 on the hourly chart of ETH/USD.

Ethereum price is now trading above $2,520 and the 100-hourly Simple Moving Average. It is also above the 76.4% Fib retracement level of the downward wave from the $2,615 swing high to the $2,442 low.

On the upside, the price could face resistance near the $2,620 level. The next key resistance is near the $2,650 level. The first major resistance is near the $2,720 level. A clear move above the $2,720 resistance might send the price toward the $2,840 resistance.

Ethereum Price

An upside break above the $2,840 resistance might call for more gains in the coming sessions. In the stated case, Ether could rise toward the $2,920 resistance zone or even $3,000 in the near term.

Another Drop In ETH?

If Ethereum fails to clear the $2,620 resistance, it could start a fresh decline. Initial support on the downside is near the $2,525 level. The first major support sits near the $2,500 zone and the trend line.

A clear move below the $2,500 support might push the price toward the $2,440 support. Any more losses might send the price toward the $2,420 support level in the near term. The next key support sits at $2,350.

Technical Indicators

Hourly MACD โ€“ The MACD for ETH/USD is gaining momentum in the bullish zone.

Hourly RSI โ€“ The RSI for ETH/USD is now above the 50 zone.

Major Support Level โ€“ $2,500

Major Resistance Level โ€“ $2,620

Bitcoin Price Blasts to New All-Time High โ€” Bulls Take the Lead

0

Bitcoin price started a fresh increase and traded to a new all-time high above the $109,000 zone. BTC is now consolidating and might aim for an increase toward $112,000

  • Bitcoin started a fresh upward move from the $106,000 zone.
  • The price is trading above $107,000 and the 100 hourly Simple moving average.
  • There is a key bullish trend line forming with support at $107,800 on the hourly chart of the BTC/USD pair (data feed from Kraken).
  • The pair could gain bullish momentum if it clears the $110,850 resistance.

Bitcoin Price Sets New ATH

Bitcoin price started a fresh increase from the $104,200 support zone. BTC formed a base and was able to clear the $106,000 resistance zone. The bulls pushed the price above $107,500.

The bulls even pumped the price above the $109,000 resistance zone. The price traded to a new all-time high near $110,698 and is currently consolidating gains above the 23.6% Fib retracement level of the upward move from the $104,270 swing low to the $110,698 high.

Bitcoin is now trading above $108,000 and the 100 hourly Simple moving average. There is also a key bullish trend line forming with support at $107,800 on the hourly chart of the BTC/USD pair.

Bitcoin Price

On the upside, immediate resistance is near the $110,850 level. The first key resistance is near the $112,000 level. The next key resistance could be $112,500. A close above the $112,500 resistance might send the price further higher. In the stated case, the price could rise and test the $113,800 resistance level. Any more gains might send the price toward the $115,000 level.

Are Dips Limited In BTC?

If Bitcoin fails to rise above the $112,000 resistance zone, it could start another correction. Immediate support on the downside is near the $109,000 level. The first major support is near the $107,500 level, the trend line, and the 50% Fib retracement level of the upward move from the $104,270 swing low to the $110,698 high.

The next support is now near the $106,500 zone. Any more losses might send the price toward the $105,000 support in the near term. The main support sits at $104,200, below which BTC might gain bearish momentum.

Technical indicators:

Hourly MACD โ€“ The MACD is now gaining pace in the bullish zone.

Hourly RSI (Relative Strength Index) โ€“ The RSI for BTC/USD is now above the 50 level.

Major Support Levels โ€“ $109,000, followed by $107,500.

Major Resistance Levels โ€“ $110,850 and $112,000.

Bitcoin Breakout Narrative Explodes As Japanโ€™s Bond Market Collapses

0

Japanโ€™s government-bond complex, once the benchmark for low-yield stability, is cracking under the weight of its own arithmeticโ€”and the fissures are sending tremors straight into the global debate about Bitcoin as a reserve asset. Thirty-year Japanese Government Bond (JGB) yields catapulted to 3.15% this week, eclipsing every prior high since the tenorโ€™s 1999 debut.

That print triggered an instant warning from the markets newsletter The Kobeissi Letter: โ€œJapanโ€™s bond market is implodingโ€ฆ Japanโ€™s 30Y Government Bond Yield has officially surged to its highest level in history, at 3.15%. For decades, Japan was known for low long-term interest rates. Now they are dealing with high inflation, shifting policy outlook, and a whopping 260% Debt-to-GDP ratio.โ€

Liquidity, always fragile at the long end of Tokyoโ€™s curve, vanished just hours later. From New York, Zerohedge relayed tradersโ€™ disbelief: โ€œThis is unbelievable: for the second day in a row, Japanโ€™s bond market is bidless, with both 30Y and 40Y JGB yields at record highs. Meanwhile, as the worldโ€™s 2nd biggest bond market is imploding, the BOJ is pretending nothing is happening.โ€

Inside the Diet, Prime Minister Shigeru Ishiba delivered a stark political gloss: Japanโ€™s fiscal plight, he conceded, is now โ€œworse than Greece,โ€ a phrase that would have been unthinkable during the deflationary 2010s. That assessment lands just as gross public debt pushes toward 260% of GDP and as Japanese investorsโ€”who still hold roughly $1.1 trillion of US Treasuriesโ€”contemplate selling overseas paper to shore up domestic books.

Why This Is Ultra-Bullish For Bitcoin

For Bitcoin analysts, the chain of causality is brutally clear. Pseudonymous macro voice Stack Hodler wrote to his followers: โ€œEveryone expects Yield Curve Control. But Japan already tried YCC and look at what it got themโ€”a spectacular bond-market implosion happening right in front of us. Now every Japanese bank, pension fund, and insurance company that trusted the Bank of Japan is holding a massive bag of flaming excrementโ€ฆ If this is the end result of YCC, why would any rational investor hold sovereign debt from severely indebted nations? Central-bank credibility is shattering in real time. Scarce neutral reserve assetsโ€”Bitcoin and goldโ€”need to be repriced dramatically higher.โ€

Dan Tapiero, founder of the $3.9 billion digital-asset vehicle 10T Holdings, reached much the same conclusion in fewer words: โ€œQuietlyโ€ฆand off the radarโ€ฆthe Japanese long-bond yields are going parabolic. Time to watch Japanโ€ฆUnsustainable deficits have been the norm for 30 yrsโ€ฆNow a problem. Very bullish gold and Bitcoin.โ€

The systemic-risk argument tightens further when one zooms out to the global balance sheet. Author Bruce Florian frames the macro math as musical chairs with a finite number of safe havens: โ€œThere are three times more debts than GDP, and interest rates are twice as high as economic growthโ€ฆ Itโ€™s like a game of musical chairs.

Everyone knows there are fewer chairs than players.โ€ Florian highlights the feedback loop linking Tokyo and Washington: โ€œThe biggest buyer of US debt has been Japanโ€ฆ But this customer is now in financial troubleโ€ฆ Thereโ€™s a high chance Japan will sell some of these bonds to stabilize its own situationโ€ฆ In a year when the USA needs to refinance $8 trillion, what happens if no buyers show up? The Fed will monetize the debt.โ€ The punch line, he insists, is Bitcoin: โ€œBitcoin is shifting from a โ€˜nice-to-haveโ€™ asset to a must-have assetโ€ฆ In a world of unlimited debt, scarcity is the most radical form of reason.โ€

Wall Street heavyweights are edging toward the same territory. JPMorganโ€™s Jamie Dimon told investors on Monday, โ€œIโ€™m not a buyer of bonds. The risks are too high.โ€ Ray Dalio wrote that the greater default risk now lies in โ€œcurrency debasement,โ€ not in missed coupons. And Larry Fink, whose firmโ€™s spot-Bitcoin ETF has absorbed more than $31 billion since January, said on Fox Business that Bitcoin is โ€œan international assetโ€ fit for times when โ€œcountries devalue their currencies.โ€

BTC Price Responds

Bitcoinโ€™s price action is responding in real time. BTC rose to $107,322 at press time, less than 4% shy of its halving-cycle high. None of this proves that Bitcoin is destined to replace sovereign debt, but the directional shift in marginal flows is no longer hypothetical. When the second-largest bond market on earth shows two consecutive bidless sessions and its prime minister compares the country to Greece, capital chases the assets whose supply cannot be printed. Bitcoin, engineered for hard-cap scarcity, slots neatly into that vacuum.

Whether this is the moment sovereign debt loses the mantle of โ€œrisk-freeโ€ remains to be seen. What is indisputable is that the implosion of Japanโ€™s ultra-long JGBs has handed Bitcoin its clearest macro tail-wind since 2020โ€™s pandemic-era liquidity floodโ€”except this time the narrative is not emergency stimulus but the dawning realization that even advanced nations are running out of balance-sheet room. For a growing cohort of investors, the word bond is beginning to rhyme less with safety and more with risk, while Bitcoin is rhymingโ€”loudlyโ€”with insurance.

Bitcoin price

Solanaโ€™s BONK Targets 77% Corrective Move After Retrace To 200 EMA

0

BONKโ€™s price action has been back and forth in May, and the cryptocurrency is now essentially back where it started the month. Recent price action reveals that the token is attempting to stabilize at around the 200 EMA after being rejected by the local high near the 0.00002581 level.ย 

This rejection led to a measured pullback towards $0.00001820. However, according to a technical analysis on the TradingView platform, the retrace appears to be forming a bullish continuation setup with a 77% corrective move in view rather than indicating a bearish reversal.

Bullish Market Structure Holds Firm For BONK

BONKโ€™s price retracement has brought it directly into a zone of heavy technical interest. At the heart of this confluence lies the 200 EMA on the 4-hour timeframe, which could technically serve as the next support zone for the meme coin moving forward. In addition, the retracement aligns with the 0.618 Fibonacci level, which is commonly associated with bullish corrections. It also aligns with a daily support zone around $0.00001832 to $0.00001841 and a resistance zone around $0.00002034.

Interestingly, this movement has led to a consolidation between these levels since May 15, and according to the TradingView analyst, the price structure suggests buyers are stepping in to defend the trend. This, in turn, has led to the formation of a higher low.ย 

BONK

From a volume standpoint, each upward impulse has shown rising volume since the first week of April. However, the recent decline occurred on diminishing volume, hinting at exhaustion from sellers.ย 

77% Upside Move If BONK Breaks Above Resistance

Even with the current range, BONK is still within a bullish setup that could send it towards a new 2025 high and possibly towards its current all-time high levels. The important level to watch now is the point of control (POC) resistance at approximately $0.00001955. This level previously acted as the pivot point before the pullback and now serves as the threshold for bullish continuation.ย 

A confirmed close above this region would likely trigger a rapid expansion move toward the next resistance cluster around $0.00002581, before eventually reaching the predicted price target of $0.00003243, which would bring it close to its January 2025 open of $0.000035. As such, the projected target if this plays out will translate to a 77% rally. The price target also aligns with a previous swing high on January 15 and January 18.

At the time of writing, BONK is trading at $0.00001995, up by 1,6% in the past 24 hours. Its reaction here, just above the POC resistance, will be an important deciding factor. If buyers manage to maintain pressure and secure a decisive breakout, the stage could be set for a strong rally into the upper resistance band and a retest of BONKโ€™s 2025 swing high.

BONK

Feds Charge Atlanta Man for Allegedly Applying for Over $3,390,000 in Fraudulent Small Business Loans During COVID

0

US authorities arrested an Atlanta man this week on charges related to his alleged connection to a COVID-19 relief loan application fraud ring.

The Department of Justice (DOJ) alleges that Ian Patrick Jackson, 37, conspired with another Atlanta man to recruit at least nine business owners to submit fraudulent Paycheck Protection Program (PPP) loan applications using fake tax documents.

Jackson allegedly told the business owners to falsely claim they each employed 16 individuals and paid monthly wages of $120,000. The DOJ says the owners then wrote falsified payroll checks to people who didnโ€™t work for them and then either kept the money for themselves or paid Jackson via his co-conspirator.

Jackson is allegedly connected to 15 fraudulent COVID-19 relief loan applications that inked $3.39 million in proceeds. Heโ€™s the 12th person to be charged in connection with an Atlanta-based PPP fraud ring, with the 11 previous defendants having already pled guilty or been convicted at trial. The DOJ says authorities have recovered nearly $1.2 million of the defrauded funds.

Jackson also allegedly applied for a separate $237,500 PPP loan using fabricated tax forms and used a forged driverโ€™s license and false revenue statements to fraudulently apply for approximately $100,000 in PPP and Economic Injury Disaster Loan (EIDL) program loans. The DOJ also says he fraudulently secured another $240,035 PPP loan and $125,000 in EIDL program loans and grants on behalf of another company.

Jackson has been charged with conspiracy to commit bank fraud, two counts of bank fraud, two counts of wire fraud and two counts of money laundering. The charges could result in decades in prison.

Follow us on X, Facebook and Telegram

Don’t Miss a Beat โ€“ Subscribe to get email alerts delivered directly to your inbox

Check Price Action

Surf The Daily Hodl Mix

&nbsp

Disclaimer: Opinions expressed at The Daily Hodl are not investment advice. Investors should do their due diligence before making any high-risk investments in Bitcoin, cryptocurrency or digital assets. Please be advised that your transfers and trades are at your own risk, and any losses you may incur are your responsibility. The Daily Hodl does not recommend the buying or selling of any cryptocurrencies or digital assets, nor is The Daily Hodl an investment advisor. Please note that The Daily Hodl participates in affiliate marketing.

Generated Image: Midjourney

The post Feds Charge Atlanta Man for Allegedly Applying for Over $3,390,000 in Fraudulent Small Business Loans During COVID appeared first on The Daily Hodl.

Bitcoin Shows Elevated Unrealized Profits Without Signs Of Panic Selling โ€“ New ATH Soon?

0

Having surged about 22.5% over the past 30 days, Bitcoin (BTC) has sparked concerns in the crypto market that its rally may be nearing exhaustion, with a potential price correction on the horizon. However, the latest on-chain data reveals that despite elevated unrealized profits, there are still no signs of increased selling pressure for the leading cryptocurrency.

Bitcoin Unrealized Profits Remain High But No Panic Selling Yet

According to a recent CryptoQuant Quicktake post by Bitcoin analyst Crazzyblockk, the cohort of new investors โ€“ those who have held BTC for less than one month โ€“ is currently sitting on unrealized profits of 6.9%.

In the same vein, short-term investors โ€“ holders who have held Bitcoin for less than six months โ€“ are sitting on unrealized profits of 10.7%. These figures highlight that the unrealized profit/loss ratio remains elevated, with unrealized profits far outweighing unrealized losses.

cq2

Crazzyblockk noted that while historically, a high percentage of unrealized profits across the network tends to precede sharp price corrections, the current setup appears different. They added:

Past cycles have shown that extreme profit concentration tends to precede volatility; however, current market structure shows no outsized concentration of risk in one participant group.

The relatively narrow spread in unrealized profits between new and short-term holders indicates that profit distribution is balanced. Furthermore, although profit levels are high, loss levels remain compressed, suggesting limited pressure from distressed sellers. The contributor remarked:

While macro conditions and volatility risk remain elevated, and a price correction cannot be ruled out, there is no strong behavioral signal suggesting a high willingness to trigger major distribution or selling.

Further Upside For BTC?

Meanwhile, seasoned crypto analyst Ali Martinez recently predicted further upside for Bitcoin. In a post on X, Martinez noted that BTC has undergone another bullish breakout, with the potential to reach a new all-time high (ATH) around $111,500.

ali

The current momentum has also drawn in retail investors. According to CryptoQuant contributor Carmelo Aleman, wallets holding less than $10,000 worth of BTC are steadily returning to the market โ€“ a sign of growing retail participation.

That said, some warning signs may still dampen BTCโ€™s current bullish trajectory. For instance, despite the recent encouraging price action, Bitcoinโ€™s Demand Momentum remains subdued.ย 

Similarly, Bitcoinโ€™s โ€œsupply scarcityโ€ narrative still lacks meaningful strength, as Aleman recently stressed that despite depleting exchange reserves, BTC is not likely to face genuine supply scarcity in the near term. At press time, BTC trades at $106,528, up 1.8% in the past 24 hours.

bitcoin

Robinhood Calls on SEC to Modernize RWA Regulation in 42-Page Proposal

0

Robinhood has submitted a proposal to the US Securities and Exchange Commission (SEC) calling for a standardized federal approach to regulating tokenized real-world assets.

The latest move seeks to bring clarity and modernization to the financial system.

Robinhoodโ€™s Proposal

In a comprehensive 42-page submission, the trading platform argues that RWAs โ€“ blockchain-based representations of tangible assets such as bonds, real estate, and equities โ€“ should be governed under the same legal standards as their traditional equivalents.

Rather than being categorized as derivatives or synthetic instruments, these digital assets would maintain their original financial identity. Robinhood argued that such a system in place would allow them to be easily integrated into the existing regulatory framework. The trading platform also added that the fragmented, state-by-state securities oversight currently in place is ill-suited for the emerging tokenized economy and poses a barrier to innovation.

To address this, it proposes the creation of a Real World Asset Exchange (RRE), a venue designed for off-chain trade execution with on-chain settlement to boost both efficiency and transparency. The platform would also incorporate strong compliance tools, including Know Your Customer (KYC) and Anti-Money Laundering (AML) solutions, through partnerships with firms like Jumio and Chainalysis.

Tokenized Real-World Assets Market

Robinhoodโ€™s proposal comes at a time when interest in the RWA space continues to grow.

The tokenized real-world asset (RWA) market could surge to $18.9 trillion by 2033, according to a recent report from Boston Consulting Group and Ripple. The forecast indicates a 53% compound annual growth rate, positioned between conservative and optimistic projections of $12 trillion and $23.4 trillion, respectively.

Tokenization, which is essentially the use of blockchain to represent and transfer ownership of physical and financial assets like securities and property, continues to attract major institutional interest. JPMorganโ€™s Kinexys platform has already facilitated over $1.5 trillion in tokenized transactions, while BlackRockโ€™s tokenized money market fund, BUIDL, also surpassed $1 billion AUM in March this year.

The post Robinhood Calls on SEC to Modernize RWA Regulation in 42-Page Proposal appeared first on CryptoPotato.

Mike Novogratz Says Weakening Dollar, Widening Deficit and Americaโ€™s Deteriorating Financial Situation โ€˜Very Goodโ€™ for Bitcoin and Crypto

0

The chief executive of crypto asset manager Galaxy Digital says Americaโ€™s current financial situation is bullish for Bitcoin (BTC) and crypto.

In a new interview with Bloomberg, Novogratz says that many factors have contributed to the rise of digital assets, including President Donald Trump and BlackRock CEO Larry Finkโ€™s embrace of the sector.

โ€œIt started with Larry Fink. When he got orange-pilled, the largest asset manager in the world said โ€˜this is a real asset,โ€™ at least Bitcoin, that everyone should be a part of and lots of other companiesโ€ฆ followed suit.

And that was kind of round one of institutions coming in. But really it was the shift of approach from the Gary Gensler SEC (U.S. Securities and Exchange Commission) to this Trump Administration which has just embraced our industry, and that freed up the animal spirit, both here and abroad.โ€

However, Novogratz goes on to say that Americaโ€™s current uncertain fiscal situation is ultimately good for the top crypto asset by market cap and the digital assets industry in general. He says the Trump administrationโ€™s failure to significantly lower the debt-to-GDP ratio has been a boon for the asset class.

โ€œWeโ€™re in a really hard position as a countryโ€ฆ We have this kind of debt, yield curves are selling off everywhere, the dollar is under pressure, and that all is very good for Bitcoin and crypto assets as well.โ€

BTC is trading for $108,961 at time of writing, just below a new all-time high.

Follow us on X, Facebook and Telegram

Don’t Miss a Beat โ€“ Subscribe to get email alerts delivered directly to your inbox

Check Price Action

Surf The Daily Hodl Mix

&nbsp

Disclaimer: Opinions expressed at The Daily Hodl are not investment advice. Investors should do their due diligence before making any high-risk investments in Bitcoin, cryptocurrency or digital assets. Please be advised that your transfers and trades are at your own risk, and any losses you may incur are your responsibility. The Daily Hodl does not recommend the buying or selling of any cryptocurrencies or digital assets, nor is The Daily Hodl an investment advisor. Please note that The Daily Hodl participates in affiliate marketing.

Featured Image: Shutterstock/WhiteBarbie/mim.girl

The post Mike Novogratz Says Weakening Dollar, Widening Deficit and Americaโ€™s Deteriorating Financial Situation โ€˜Very Goodโ€™ for Bitcoin and Crypto appeared first on The Daily Hodl.

The XRP Rebound Blueprint: Double Bottom Could Fuel A Run To $2.80 Resistance

0

In a recent update on X, market analyst CRYPTOWZRD highlighted a developing double bottom formation on the XRPBTC chart, suggesting a possible bullish reversal may be underway. Although XRP ended the previous session with indecisive movements, this emerging pattern could drive its price action higher. Should the reversal confirm, XRP is likely to push toward the $2.80 resistance zone.ย 

Bitcoin Dominance Pressures Altcoins, XRP Included

Expanding on his initial analysis, the analyst noted that XRP and XRPBTC closed their daily candles indecisively, reflecting ongoing market uncertainty and a lack of strong directional action. While XRPBTC is currently holding above a key double bottom formation, the analyst emphasized that the pair still appears relatively weak and requires more stable and constructive price action to confirm a bullish breakout. A strong reaction from this level could serve as a catalyst, helping XRP gain momentum from its current position on the chart.

He also pointed out that Bitcoin dominance continues to exert pressure on altcoins, including XRP, causing them to underperform in their BTC pairs. As Bitcoin dominance approaches a major resistance level, the analyst anticipates a reversalย that could shift capital flow back into altcoins. Such a reversal would provide a favorable environment and support a broader bullish continuation for XRP.

XRP

Looking ahead, the analyst stated that his focus will remain on the lower time frames throughout the next trading session to determine the next scalp opportunity, particularly if XRPBTC begins to show signs of recovery and buyers step in with stronger momentum.

Waiting On Confirmation: No Entry Without A Clear Move

Concluding his analysis, the analyst provided his outlook for the near-term price action, noting that intraday trading was choppy and lacked clear direction throughout the session. Despite the indecisiveness, he predicts a potential upside continuation if the price breaks above the $2.4650 intraday resistance level.ย 

Conversely, he identified $2.3160 as a crucial intraday support level, where buyers may step in if the market pulls back. This zone will be important to watch, as a breakdown below it could delay any immediate bullish momentum and signal further consolidation. The price action between these two levels will likely define the short-term direction for XRP.

He emphasized that patience is key at this stage, urging traders to wait for a clear and healthy move before considering new entries. With market conditions still uncertain, the analyst plans to stay focused on refined setups and mature formations to ensure higher-probability trades in the sessions ahead.

XRP

Translate ยป