Tuesday, November 18, 2025

Advertise

spot_img
Home Blog Page 1030

Ethereum Fails To Break $2,100 Resistance – Growing Downside Risk?

0

Ethereum has lost its grip on the key $2,000 level, reigniting fears of a deeper correction as selling pressure returns to the market. Since March 19, ETH has managed to hold above $1,930, but recent weakness has pushed the price dangerously close to breaking below the $1,900 mark. The drop has added fuel to bearish speculation, with traders and analysts now questioning whether a larger pullback is underway.

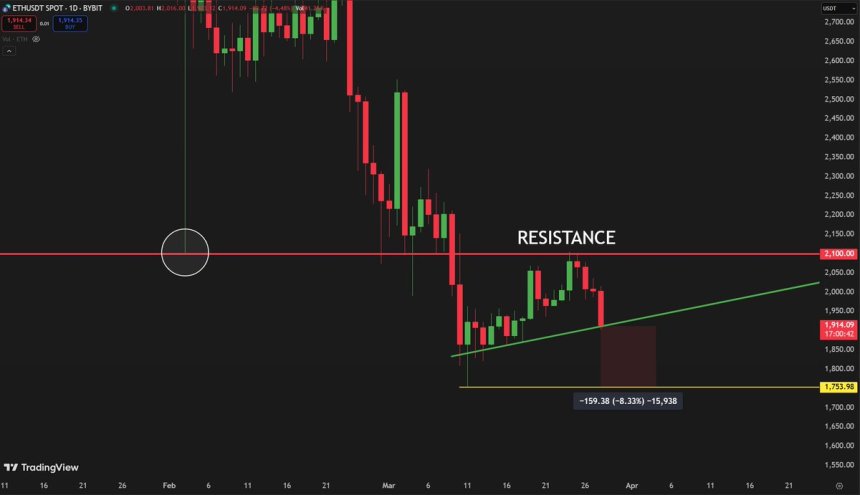
The inability to hold above psychological support levels has weighed heavily on sentiment, especially as broader market volatility continues to grow. Top analyst Carl Runefelt shared his outlook on Ethereum’s current structure, noting that the asset has repeatedly failed to overcome resistance at $2,100 — a level that now acts as a firm ceiling for bullish momentum. According to Runefelt, this repeated rejection suggests Ethereum could be in serious trouble if buyers don’t step in soon.

With momentum fading and no clear catalyst in sight, Ethereum risks slipping further if $1,900 fails to hold. Traders are watching closely for signs of a reversal, but for now, the path of least resistance appears to be downward. ETH must regain lost levels quickly to avoid confirming a broader bearish trend.

Bulls Face Key Test As Resistance Weighs on Price Action

Ethereum is under pressure as the broader crypto market faces one of its most crucial tests in months. With macroeconomic uncertainty mounting and fears of a potential recession in the United States, risk assets across the board are struggling to gain traction — and Ethereum is no exception. The current market environment remains hostile, with inflation concerns, unstable monetary policy, and global trade tensions shaking investor confidence.

ETH’s price action has been particularly underwhelming. Despite widespread expectations that Ethereum would lead a strong rally in early 2025, the asset has failed to meet bullish projections. Instead of gaining ground, ETH has stalled and is now struggling to hold support levels amid growing selling pressure.

Runefelt’s bearish outlook suggests that Ethereum has repeatedly failed to break through the $2,100 resistance level. According to Runefelt, this resistance zone is critical — and Ethereum’s inability to overcome it could be a sign of deeper weakness ahead. He warns that if Bitcoin experiences a breakdown, Ethereum could follow and potentially retest the wick near $1,750, which marked a local low during a previous correction.

Ethereum facing selling pressure below $2,100 | Source: Carl Runefelt on X

With momentum fading and no clear bullish catalyst in sight, Ethereum’s price structure remains fragile. Unless bulls reclaim key levels soon, ETH could face a deeper retrace, especially if broader market sentiment continues to deteriorate.

Traders are closely watching Bitcoin and macroeconomic developments for cues, knowing that a decisive move in either direction could shape Ethereum’s next major trend. For now, the pressure is on — and Ethereum’s resilience is about to be tested.

ETH Bulls Struggle to Hold Key Support

Ethereum (ETH) is currently trading at $1,910 after failing to hold above the critical $2,000 level, a psychological and technical barrier that has now flipped into resistance. The breakdown has weakened short-term momentum and left bulls in a defensive position as selling pressure continues to mount.

ETH trading below $2,000 | Source: ETHUSDT chart on TradingView

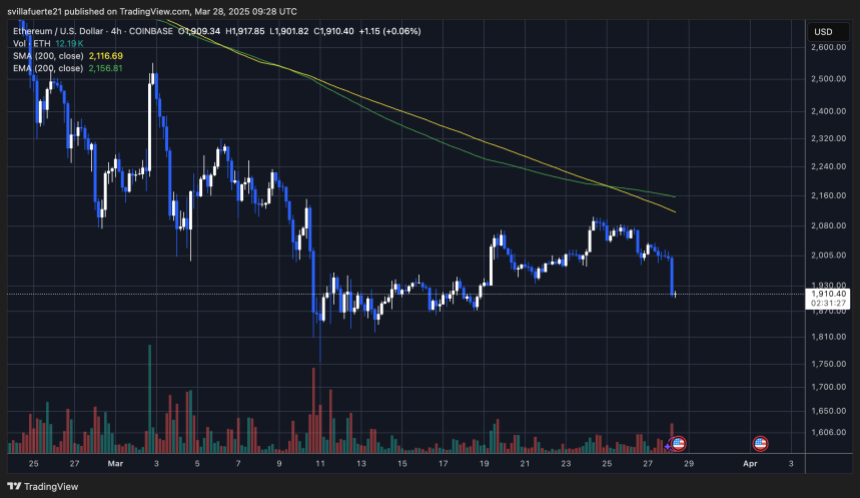
At this stage, the $1,880 level has emerged as a key support zone that bulls must defend to avoid a deeper correction. Holding this level could allow for a consolidation phase and give Ethereum a chance to stabilize before attempting another push higher. However, if ETH loses $1,880, it could spark a wave of aggressive selling, triggering a continuation of the current downtrend and potentially pushing the price toward the $1,750 range.

To regain control of the trend, bulls must reclaim the $2,000 mark as soon as possible. A decisive move back above this level would signal renewed strength and could open the door for a rebound toward higher resistance zones. Until then, Ethereum remains in a fragile position, with the risk of further downside growing as macroeconomic pressure and technical weakness continue to weigh on price action.

Featured image from Dall-E, chart from TradingView 

Binance Listing Effect Causes Mubarak Coin Price to Crash 40%

0

Binance Listing Effect Causes Mubarak Coin Price to Crash 40%

The Binance listing is one of the bullish events in the crypto market, but that’s not what happened with the Mubarak meme coin price. As a newly launched token, it is often in the limelight, especially as the former Binance CEO Changpeng Zhao showed support for this meme-themed cryptocurrency. As a result, its price saw many uptrends, but today, it is different as it is down by 40%. Why? Let’s discuss this.

Mubarak Meme Coin Price Crashes With Binance Listing

Binance recently listed four cryptocurrencies, including Mubarak. Although it was expected, the Mubarak meme coin price crash came unexpectedly. Experts believe this happened as the sellers were prepared to benefit from the potential rally.

Although the token did witness a rally at first, hitting $0.011, it soon crashed amid seller’s activity. At present, it trades at $0.08652 after bearing a 40% loss today and 60% away from the ATH of $0.2158, set ten days ago.

Mubarak meme coin price crash

Interestingly, when this token plummeted, the three other listed tokens, i.e., BROCCOLI, TUT, and BANANAS31, had significant uptrends, disappointing investors.

Crypto Whales to Blame For Mubarak Crash

Talking of the Mubarak coin price crash, the 205% surge in the trading volume reveals that the investors’ activity is high. A significant portion of this is from the crypto whales, which are on a selling spree and fueling this crash.

Lookonchain X’s post revealed one such whale who had deposited 6.14M Mubarak earlier in the day. Interestingly, the whale itself made nearly $760k in profits, but the activity resulted in increasing the selling pressure on the token.

Mubarak Whale

Another whale has deposited 10.28M Mubarak on Binance and sold it at a loss. Experts claim such sell-offs are made voluntarily to bring the token down before fueling a price reversal.

Experts Predict Mubarak Meme Coin Price to Surge 5x

According to crypto experts, Changpeng Zhao’s connection to Mubarak will bring price rallies. One such claim is that even though the initial outcome of the Binance listing turned into correction, it is up for a 5x surge due to historical trends and upcoming Eid Mubarak celebrations.

Another pointed out a potential breakout from the symmetrical triangle pattern. He claimed that the bull’s presence would push its price above key resistances before predicting a Mubarak meme coin price rally to $0.17.

However, the ongoing bearish trend is hard to ignore, where the key resistance is at $0.14 and $0.16. More importantly, the RSI, MACD, and key moving average indicate a bearish momentum.

Mubarak coin price

Investors must keep an eye on the performance, as its key support is $0.086. A bounce from this could bring an uptrend. In contrast, a drop can push it toward $0.08.

The post Binance Listing Effect Causes Mubarak Coin Price to Crash 40% appeared first on CoinGape.

3 Ethereum Rivals to Buy Now as ETH Price Crashes Below $2,000

0

3 Ethereum Rivals to Buy Now as ETH Price Crashes Below $2,000

Ethereum price fell below $2,000 on Thursday, March 28, as the crypto market reeled amid intense volatility and bearish pressure. This decline has shifted the attention of traders from ETH to Ethereum rivals that can record significant gains in price. 

Ethereum Price Crashes Below $2,000 Amid Weak Demand

Ethereum price trades at $1,906 at press time, marking its lowest level in more than a week amid US PCE inflation. On the weekly chart, ETH had formed a triple-top pattern, which suggests that the price is about to make a sharp reversal from an uptrend to a downtrend. 

ETH price has been rejected again at the neckline of this triple top, which means that the bearish pressure is strong. If the downtrend progresses, it is possible that Ethereum will fall to $1,520. 

3 Ethereum Rivals to Buy Now as ETH Price Crashes Below $2,000
ETH/USD: 1-week Chart

Besides the weak retail demand that is forcing Ethereum price to drop, institutions also appear uninterested in accumulating during the dip. Data from SoSoValue shows that spot ETH ETFs have experienced three weeks of persistent outflows. 

Amid these bearish headwinds, crypto traders are looking for the best Ethereum rivals that they can buy. 

Top 3 Ethereum Rivals to Buy 

The top 3 Ethereum rivals to buy after ETH price dropped below $2,000 include Ripple (XRP), Solana (SOL) and Cardano (ADA). 

Ripple (XRP)

The top Ethereum rival to buy today is XRP. This altcoin shows signs of outperforming ETH after the XRP/ETH ratio surged to its highest level since November 2020. Additionally, this ratio is at the upper Bollinger band, which further suggests a bullish outlook, which could cause a breakout to the all-time high price of 0.0036. 

3 Ethereum Rivals to Buy Now as ETH Price Crashes Below $2,000
XRP/ETH: 1-week chart

Besides this rising ratio, other factors suggest that XRP can outperform ETH. XRP is at a pivotal point after the Ripple lawsuit was dismissed. The Ripple army is optimistic that the end of the case will attract interest from institutions through spot ETFs. On Polymarket, the odds of an XRP ETF being approved by the end of the year have soared to 85%. 

Solana (SOL) 

Solana is another Ethereum rival to buy for significant gains. Just like XRP, Solana has outperformed ETH in recent months, with catalysts like a spot ETF application by Fidelity and adoption by BlackRock for the BUIDL fund set to drive further gains. 

The daily price chart shows a looming Solana bullish breakout that could lead to gains. This happened after SOL touched resistance at the upper trendline of a falling parallel pattern. If the MACD line crosses above the zero line to confirm a bullish momentum, it could lead to SOL escaping this bearish pattern. 

3 Ethereum Rivals to Buy Now as ETH Price Crashes Below $2,000
SOL/USDT: 1-day Chart

Cardano (ADA) 

The other Ethereum rival that traders should consider buying today for significant gains is Cardano. The Cardano network is recording a significant uptick in global adoption after TapTools revealed that it has surpassed 5.25 million wallets. 

Cardano price is currently trading within a consolidation range. However, the AO is rising, suggesting that bulls might regain control. If buyers break ADA price from this consolidation zone, it might spark a rally towards the 161.8% Fibonacci level of $1.54. 

3 Ethereum Rivals to Buy Now as ETH Price Crashes Below $2,000
ADA/USDT: 1-day Chart

Final Thoughts on Ethereum Rivals to Buy

Ethereum price has dropped below the critical support level of $2,000, suggesting that bearish headwinds might push the price down further. Amid this drop, the top Ethereum rivals that traders can buy today include XRP, Solana, and Cardano. 

The post 3 Ethereum Rivals to Buy Now as ETH Price Crashes Below $2,000 appeared first on CoinGape.

Is Bitcoin’s Bull Market Truly Back?

0

Bitcoin Magazine

Is Bitcoin’s Bull Market Truly Back?

Following a sharp multi-week selloff that dragged Bitcoin from above $100,000 to below $80,000, the recent price bounce has traders debating whether the Bitcoin bull market is truly back on track or if this is merely a bear market rally before the next macro leg higher.

Bitcoin’s Local Bottom or Bull Market Pause?

Bitcoin’s latest correction was deep enough to rattle confidence, but shallow enough to maintain macro trend structure. Price seems to have set a local bottom between $76K–$77K, and several reliable metrics are beginning to solidify the local lows and point towards further upside.

The Net Unrealized Profit and Loss (NUPL) is one of the most reliable sentiment gauges across Bitcoin cycles. As price fell, NUPL dropped into “Anxiety” territory, but following the rebound, NUPL has now reclaimed the “Belief” zone, a critical sentiment transition historically seen at macro higher lows.

Figure 1: The NUPL indicates a bullish rebound in sentiment. View Live Chart

The Value Days Destroyed (VDD) Multiple weighs BTC spending by both coin age and transaction size, and compares the data to a previous yearly average, giving insight into long term holder behavior. Current readings have reset to low levels, suggesting that large, aged coins are not being moved. This is a clear signal of conviction from smart money. Similar dynamics preceded major price rallies in both the 2016/17 and 2020/21 bull cycles.

Figure 2: The largest and most experienced bitcoin holders have stopped selling. View Live Chart

Bitcoin Long-Term Holders Boost Bull Market

We’re also now seeing the Long Term Holder Supply beginning to climb. After profit-taking above $100K, long-term participants are now re-accumulating at lower levels. Historically, these phases of accumulation have set the foundation for supply squeezes and subsequent parabolic price action.

Figure 3: Long Term Holder BTC supply is rapidly increasing. View Live Chart

Bitcoin Hash Ribbons Signal Bull Market Cross

The Hash Ribbons Indicator has just completed a bullish crossover, where the short-term hash rate trend moves above the longer-term average. This signal has historically aligned with bottoms and trend reversals. Given that miner behavior tends to reflect profitability expectations, this cross suggests miners are now confident in higher prices ahead.

Figure 4: Bitcoin miners are becoming bullish once again. View Live Chart

Bitcoin Bull Market Tied to Stocks

Despite bullish on-chain data, Bitcoin remains closely tied to macro liquidity trends and equity markets, particularly the S&P 500. As long as that correlation holds, BTC will be partially at the mercy of global monetary policy, risk sentiment, and liquidity flows. While rate cut expectations have helped risk assets bounce, any sharp reversal could cause renewed choppiness for Bitcoin.

Figure 5: BTC remains highly correlated to US Equities. View Live Chart

Bitcoin Bull Market Outlook

From a data-driven perspective, Bitcoin looks increasingly well-positioned for a sustained continuation of its bull cycle. On-chain metrics paint a compelling picture of resilience for the Bitcoin bull market. The Net Unrealized Profit and Loss (NUPL) has shifted from “Anxiety” during the dip to the “Belief” zone after the rebound—a transition often seen at macro higher lows. Similarly, the Value Days Destroyed (VDD) Multiple has reset to levels signaling conviction among long-term holders, echoing patterns before Bitcoin’s rallies in 2016/17 and 2020/21. These metrics point to structural strength, bolstered by long-term holders aggressively accumulating supply below $80,000.

Further supporting this, the Hash Ribbons indicator’s recent bullish crossover reflects growing miner confidence in Bitcoin’s profitability, a reliable sign of trend reversals historically. This accumulation phase suggests the Bitcoin bull market may be gearing up for a supply squeeze, a dynamic that has fueled parabolic moves before. The data collectively highlights resilience, not weakness, as long-term holders seize the dip as an opportunity. Yet, this strength hinges on more than just on-chain signals—external factors will play a critical role in what comes next.

However, macro conditions still warrant caution, as the Bitcoin bull market doesn’t operate in isolation. Bull markets take time to build momentum, often needing steady accumulation and favorable conditions to ignite the next leg higher. While the local bottom between $76K–$77K seems to hold, the path forward won’t likely feature vertical candles of peak euphoria yet. Bitcoin’s tie to the S&P 500 and global liquidity trends means volatility could emerge from shifts in monetary policy or risk sentiment.

For example, while rate cut expectations have lifted risk assets, an abrupt reversal—perhaps from inflation spikes or geopolitical shocks—could test Bitcoin’s stability. Thus, even with on-chain data signaling a robust setup, the next phase of the Bitcoin bull market will likely unfold in measured steps. Traders anticipating a return to six-figure prices will need patience as the market builds its foundation.


If you’re interested in more in-depth analysis and real-time data, consider checking out Bitcoin Magazine Pro for valuable insights into the Bitcoin market.

Disclaimer: This article is for informational purposes only and should not be considered financial advice. Always do your own research before making any investment decisions.

This post Is Bitcoin’s Bull Market Truly Back? first appeared on Bitcoin Magazine and is written by Matt Crosby.

XRP Lawsuit: Why the US SEC Is Delaying the Ripple Case?

0

XRP Lawsuit: Why the US SEC Is Delaying the Ripple Case?

The Securities and Exchange Commission’s (SEC) decision to drop lawsuits against several major crypto players has left the Ripple case as a notable exception. Recently, the US SEC dismissed litigations against Kraken, Cumberland, and Consensys, sparking curiosity about the status of the XRP lawsuit. Fox Business journalist Eleanor Terrett took to X to share insights on the possible reasons behind the SEC’s delay in the Ripple case.

Let’s take a closer look at the Ripple case and the SEC’s decision to exclude the platform while dropping lawsuits against other crypto companies.

Is US SEC Further Delaying the XRP Lawsuit?

In her recent X post, Fox Business reporter Eleanor Terrett shared insights on the possible reasons for the SEC’s delay in the XRP lawsuit. While the SEC intentionally missed Ripple while dismissing cases against other major firms, Terret stated that the move wasn’t surprising.

Emphasizing the unique circumstances of the Ripple case, Terrett stated, “No Ripple here but I’m not entirely surprised because, again, it is slightly different to these other cases.” The journalist pinpointed the complexities surrounding the XRP lawsuit unlike other crypto lawsuits.

The SEC’s approach to resolving the XRP lawsuit differs from other crypto cases due to an existing injunction. To move forward, the SEC must request Judge Torres to lift this injunction, allowing them to proceed with voting on the withdrawal of the appeal and other related matters.

SEC Dismisses Kraken, Cumberland, Consensys Cases

In a recent development, the US SEC officially announced the dismissal of the crypto lawsuits involving Kraken, Cumberland, and Consensys. This decision comes after the SEC filed a joint stipulation with each company. The filing agrees to dismiss the cases with prejudice, meaning they cannot be refiled.

It is noteworthy that the dismissal comes without any financial implications for the crypto firms. Dropping the lawsuits, the Commission underscored the irrelevance of the cases. However, the regulator clarified that its decision does not imply a change in its position on the underlying issues of the lawsuits.

As highlighted by Terrett, these dismissals do not impact or influence the ongoing XRP lawsuit. Meanwhile, the Ripple lawsuit is expected to follow specific procedures, which may lead to a delay in its conclusion. The settlement process for the Ripple lawsuit involves several steps. This includes the SEC’s request to lift the existing injunction and the subsequent voting on the withdrawal of the appeal.

Recently, attorney Fred Rispoli shared a possible timeline for the Ripple case settlement. He stated that the lawsuit will end within the next 60 days.

How This Delay in the Ripple Lawsuit Settlement Impact XRP Price?

Amidst the complexities and uncertain timeline surrounding the Ripple case settlement, the XRP price faces major corrections. As of press time, XRP is trading at $2.21, with a 5.38% dip in a single day. Over the past week and month, XRP has plummeted by 6.7% and 2.2%, respectively.

Despite this negative trend, a positive sentiment persists among investors, as indicated by a 17.6% surge in trading volume, currently at $3.85 billion. This sparks a bullish prediction for XRP, with analysts foreseeing its ascendance to $11.

The post XRP Lawsuit: Why the US SEC Is Delaying the Ripple Case? appeared first on CoinGape.

Trade Idea for XRP Price if SEC Approves Ripple ETF Tomorrow

0

XRP price has lost momentum recently and crashed from this month’s high of $3 to $2.20. This trend may soon end if the Securities and Exchange Commission (SEC) moves ahead and approves the 16 spot Ripple ETFs that have been applied. This article explores a near risk-free trade idea if the SEC approves these ETFs tomorrow.

XRP Price Could Rise if SEC Approves Ripple ETF

XRP, the third-biggest cryptocurrency, has seen increased demand from retail and institutional investors lately. One sign of this is the fact that it has had the most spot ETF applications this year, totaling 18. Wall Street companies like Bitwise, Grayscale, Canary, and Fidelity have all applied for these funds. 

Odds of these ETFs have jumped in the past few months, moving from 59% in January to 85% today. These odds have remained elevated after the SEC ended its Ripple appeal this month.

Polymarket ETF Odds
Polymarket ETF Odds


Analysts expect the XRP price to explode higher in case of approval. One analyst hinted that the price of Ripple would jump to $5, while another one sees XRP hitting $8. These forecasts point to big swings ahead for a coin trading at $2.2. 

Trade Idea for Ripple for the Ripple ETF Approval

Traders have several strategies to anticipate the potential XRP ETF approval. One of these approaches is just to go long the coin, and hope that the approval will push it much higher after the approval.

The risk with this approach is that the XRP price has formed a head and shoulders pattern on the daily chart. Its head is at around $3.40, while the shoulders and neck are at $3 and $1.94, respectively. 

XRP Price Formed a H&S pattern

A H&S pattern is one of the most bearish patterns, meaning that a breakdown is possible, especially when it loses the support at $1.9447. This risk exists because it is unclear when the SEC will approve the XRP ETFs. 

Another approach is to use long-dated call options to position for the XRP ETF approval. A call option is a trade that gives one a right, but not an obligation to buy an asset at a certain strike price. Consider the following scenario if you expect the Ripple price to hit $3.5 by June 27, when the approval will have happened.

  • Strike: $3.50
  • Ask price: $0.217
  • Delta: 0.32
  • Max Risk: $0.217
  • Max profit: Unlimited
  • Breakeven price at expiry: $3.717

In this case, your risk will be capped and have an unlimited profit potential, if you expect the coin to jump to $3.50. 

Another approach is to buy a $4/$5 call spread, where you risk about $0.076 to potentially make $0.924, representing a 12x return if the coin closes at or above $5.

XRP Options Table for June

Summary

The upcoming XRP ETF approval may lead to a strong surge in the coming months, and the options market provides better scenarios. As this report demonstrates, the options market provides an ideal opportunity from a risk-reward perspective.

The post Trade Idea for XRP Price if SEC Approves Ripple ETF Tomorrow appeared first on CoinGape.

Why is Ethereum Price Crashing Despite Bullish ETF Staking Fundamentals?

0

Why is Ethereum Price Crashing Despite Bullish ETF Staking Fundamentals?

Bitcoin (BTC) crashed 4% from a high of $88.7K on March 24 to 85.1K as of Friday. Due to Ethereum’s high correlation with BTC, Ethereum price has shed nearly 12% from a high of $2,104 to $1,854. 

On March 27, 2025, CryptoQuant.com shared an update on X about Bitcoin’s bearish market outlook. The post highlights a trend where major players, or “whales,” are reducing their leveraged positions. Based on the Inter-exchange Flow Pulse (IFP) indicator, their analysis shows less Bitcoin moving from spot to derivatives exchanges, a sign of declining risk appetite among these big investors. Historically, this downward IFP trend has often signaled bearish price movements for Bitcoin, as seen in the chart spanning 2018 to 2025.

Bitcoin’s Bearish Price Outlook

Hence, a further drop in Bitcoin price could also increase the selling pressure for ETH.

Additionally, the second main reason for Ethereum price crash is the en masse dumping of 14,064 ETH, valued at $27.5 million for stablecoin DAI, over the past few hours. According to reports, these funds are linked to the $1.4 billion Bybit hack that occurred in February 2025. Large-scale dumps could pressure ETH’s price downward, especially with the crypto market outlook and sentiment already bearish.

Despite this recent crash and potential sell-offs in the future, the outlook for Ethereum price remains bullish with the anticipation of staking approval from the SEC. 

Bullish Ethereum Fundamentals, Breath Hope Amid Bearish Crypto Market Sentiment

An unusual spike in Ethereum validators joining the network has upped hopes for ETH supporters. The sharp uptick in validator entries indicates growing anticipation among investors and stakers, likely driven by speculation around the approval of Ethereum ETF staking, which could be key in bringing the bullish momentum back to ETH.

ETH Validator Count Spikes Anticipating ETF Staking Approval

This validator rush suggests confidence in Ethereum’s future price potential and staking rewards, especially following its 2024 price climb from $2,300 to $3,300. Will this bullish Ethereum price prediction catalyze a similar rally, but this time propel ETH to tag $5,000 after an explosive move? 

Ethereum Price Prediction and Analysis

The Time Price Opportunity (TPO) chart shows that Ethereum dropping in the composite value area, extending from $1,874 to $1,924. The chances of ETH price stabilizing here are high. Hence, bottoming signals here could be key catching the next swing long trade.

However, the key resistance levels to book profits include – $2,180, $2,236, and $2,362. 

These are nPOC or naked Point of Controls, which represents highest trading volume levels for previous days that have not been tagged yet.

Why is Ethereum Price Crashing Despite Bullish ETF Staking Fundamentals?
ETH/USDT 4-hour chart

Investors need to focus on short-term swings rather than putting out bullish price forecasts due to the uncertain nature of the crypto market outlook due to Bitcoin’s lack of direcitonal bias.

The post Why is Ethereum Price Crashing Despite Bullish ETF Staking Fundamentals? appeared first on CoinGape.

Sei Blockchain to Acquire 23andMe: On-Chain Genetic Data Plans Revealed

0

Sei Blockchain, the layer-1 chain in a significant bet towards the developing concept of decentralised science, has announced the acquisition of 23andMe after the latter filed for the Chapter-11 Bankruptcy.

The California-based genetic testing and biotech company, 23andMe, has been offering DNA testing via saliva samples for millions of Americans since 2007.

Arguably, Sei revealed in a X post that it is acquiring 23andMe “to defend the genetic privacy of 15 million Americans and ensure their data is protected for generations to come”

Coming amidst the financial vulnerabilities of 23andMe, the Chapter 11 bankruptcy under the U.S. Bankruptcy Code allows businesses (and sometimes individuals) to reorganize their debts while continuing operations.

Decoding the Sei Blockchain’s 23andMe Acquisition

Sei Blockchain has called the genetic data privacy as a national security concern. As per the 23andMe acquisition update, Sei is aiming to bring all the genetic data collected by 23andMe over the years on the Sei Blockchain.

Notably, Blockchain’s immutable and decentralized nature can reduce the risk of unauthorized access and data breaches. It will further return data ownership to users through encrypted, confidential transfers.

With Sei Blockchain’s acquisition, users will also have opportunities to monetize their data by either consenting to participate in research studies or share information with pharmaceutical companies. Since all the transactions will be transparently recorded on the blockchain, users can be contended about security.

As 23andMe approached Bankruptcy, several attorney generals including NY Attorney General Letita James have already asked the firm to delete the genetic data of millions of Americans that it has collected over the years. As its stock declined by 59% after the bankruptcy announcement, many users have already started deleting their accounts.

On the contrast, recently, Donald Trump’s DeFi project World Liberty Financial acquired another 541,242 SEI coins, pushing the SEI price up by 7.3%.

As revealed in the Bankruptcy notice, Anne Wojcicki has resigned from her role as Chief Executive Officer, effective immediately, by mutual agreement between Ms. Wojcicki and the Special Committee.

But What lead 23andMe to go Bankrupt?

In 2007, 23andMe became the first company to offer at-home genetic testing, allowing individuals to send a saliva sample for DNA analysis.

However, once a leader in at-home DNA testing is set to be acquired by Sei Blockchain after it filed for Chapter 11 bankruptcy on March 23.

Initially, the company saw strong sales, but interest in genetic testing waned, leading to unsustainable revenue. Despite securing major investments, including $300 million from GlaxoSmithKline and a $3.5 billion valuation upon going public in 2021, 23andMe failed to develop a recurring revenue model.

Sei blockchain

The company also faced reputational damage due to a 2023 data breach that compromised 6.9 million customer records, leading to lawsuits and eroding consumer trust. Additionally, a costly $400 million acquisition of Lemonaid Health in 2021 did not yield expected financial returns.

Internal leadership struggles further contributed to instability with the entire independent board resigning in late 2024. And now as part of its bankruptcy filing, 23andMe is now looking to sell its genetic database – the opportunity that Sei Blockchain is seeking to seize.

Pioneering move for DeSci?

By integrating 23andMe’s genetic records onto the Sei blockchain, the Sei foundation can provide users with secure, encrypted control over their personal information.

This approach also aligns with the principles of Decentralized Science (DeSci), which seeks to apply blockchain technology to scientific research and data management. This notably helps in promoting transparency and user empowerment.

However, ensuring the accurate and secure transfer of vast amounts of sensitive genetic data to the Sei blockchain would be a daunting task for Sei.

But if successful, this endeavor could redefine data ownership and privacy in the genomic era, and empower individuals with unprecedented control over their most personal information – GENETIC!


The post Sei Blockchain to Acquire 23andMe: On-Chain Genetic Data Plans Revealed appeared first on CoinGape.

4 Meme Tokens That Could 100X After this Key Binance Listing

0

4 Meme Tokens That Could 100X After this Key Binance Listing

The meme coin market has recently drawn significant interest even though it experiences slight market correction at present. The market capitalization of new meme coins keeps growing to reach $2.76 trillion even while more meme coins enter the market. Now that Binance lists them investors show interest in meme tokens which they believe will experience significant price appreciation.

4 Meme Tokens to Watch for a Potential 100X After Binance Listing

The first group of tokens that Binance chose to advertise in its vote-to-list program has now been announced. The listed tokens in this vote-to-list campaign are MUBARAK, BROCCOLI714, TUT, and BANANAS31. 

Every token issued by Binance will incorporate Seed Tags. The announcement signifies a major development for meme tokens because they are now part of Binance. The inclusion of these tokens introduces a potential investment chance that could reach 100 times. Among these meme coins are Dogecoin, PEPE, SHIB, And POPCAT.

Dogecoin (DOGE)

Dogecoin (DOGE) managed to break through an important falling wedge pattern in its price movement. The market indicates that Dogecoin is currently forming patterns inside a symmetrical triangular structure on its charts. DOGE went up by 10% during the previous week to reach a value of $0.1814. 

The significant weekly price rise has positioned Dogecoin as one of the top meme investments while it keeps moving upward. The Binance listing of DOGE led to increased investor attraction, which motivated analysts to predict a potentially significant increase in its value.

Market analysts consider support at $0.177 as the primary key while resistance exists at $0.207. The value of Dogecoin depends on these fundamental price zones which determine its future market shifts.

Image

Pepe Coin (PEPE)

Pepe Coin (PEPE) captured widespread market interest after it displayed a 10% price increase during the last week. At the current writing period, PEPE shows a 3% price correction that reduced its worth to $0.000007915. 

Pepe Coin maintains its standing as one of the most sought-after meme coins despite its small setback. The coin holds great potential for growth because analysts predict significant gains once Binance does an expected listing that will drive a 100X price surge.

(Popcat) POPCAT 

The price of Popcat Token increased by 20% throughout the last seven days, reaching $0.2256. The token currently stands at a price of $0.2256 following a minimal decrease in market value. Experts anticipate that the Popcat price will keep increasing despite its current value. 

The meme currency Popcat interests investors because it shines as a notable example among other meme tokens. 

The upcoming addition to Binance will create extra support for Popcat to become one of the prominent meme tokens for prospective investors seeking substantial growth.

Shiba Inu (SHIB)

The price of Shiba Inu (SHIB) has maintained a range between $0.00001318 while achieving a 5% increase during the previous week. The price of SHIB reached $0.000015 during a specific period before returning to $0.000012. The market stands ready to launch an additional price increase. 

A bullish trend across the broader market indicates that SHIB has the potential to reach the $0.00002 price mark. Crypto specialists discovered an 18% total earnings as the token conducts well on its upward path. The investor community continues to monitor SHIB for its upcoming major market movement.

Image

Final Thoughts

To sum up, The attention surrounding meme tokens increased following their exchange listings at major platforms such as Binance, which led to increased potential for significant market growth.

The post 4 Meme Tokens That Could 100X After this Key Binance Listing appeared first on CoinGape.

Uniswap (UNI) 
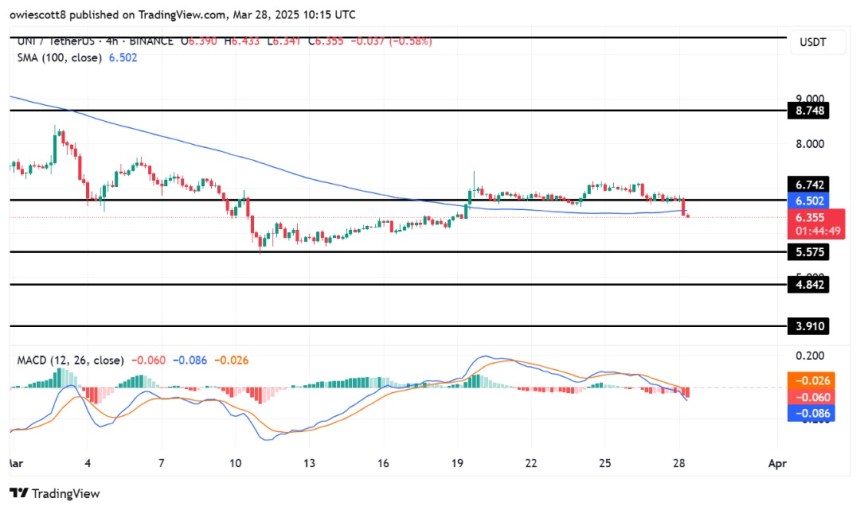
In Trouble? Price Crash Below $6.7 Signals Bigger Problems

0

Uniswap (UNI) has slipped below the crucial $6.7 support level, raising concerns about a potential extended downturn. This breakdown comes amid increasing selling pressure, signaling that the bulls may be losing their grip on the market

With volatility rising and market uncertainty growing, the next few trading sessions will be crucial in determining whether UNI can bounce back or if a prolonged downtrend is on the horizon. Will the bulls reclaim lost ground, or is UNI heading for even lower levels?

Price Action and Technical Indicators Flash Warning Signs

UNI’s price action is showing clear signs of weakness as the token struggles to regain momentum after breaking below the $6.7 support level. The recent downturn has intensified bearish sentiment, with sellers dominating the market and pushing UNI toward lower support levels. If buying pressure doesn’t return soon, further losses could be imminent.

The asset has dropped below its 100-day Simple Moving Average (SMA), a key long-term support level. This breakdown suggests a potential shift toward a broader downtrend, especially if UNI fails to reclaim this level quickly. A prolonged stay below the 100-day SMA could reinforce seller dominance, increasing the risk of further declines.

Uniswap

Meanwhile, the MACD has flipped bearish, with the signal line crossing below the MACD line, a classic indication that sellers are gaining strength. Additionally, Uniswap trading volume has declined, suggesting a lack of strong bullish participation to counteract the selloff.

For Uniswap to regain strength, buyers must push the price back above $6.7 with strong volume, invalidating the breakdown. Until then, the risk of more downside toward $5.5 and $4.8 remains high.

Can Uniswap Reclaim $6.7 and Reverse Course?

Uniswap is at a critical inflection point after its recent breakdown below $6.70. As UNI struggles to regain momentum, traders and investors are left wondering whether this drop is just a temporary setback or the start of a deeper correction.

While bears have dominated recent price action, the market questions whether UNI can fight its way back above this key level or if the resistance will hold. If UNI manages to break and hold above $6.7 with robust buying volume, it could indicate that bullish momentum is returning, invalidating recent bearish pressure and signaling a potential trend reversal. 

A decisive breakout above this level would restore investor confidence and also attract more buyers, leading to an extended rally. Should this scenario unfold, UNI might gain traction toward $8.7, with a sustained push driving the price to $10.3 and beyond in the coming weeks.

Uniswap

Translate »