Thursday, November 20, 2025

Advertise

spot_img
Home Blog Page 1029

Mastermind Behind SEC SIM Swapping Scheme Sentenced to 14 Months in Prison for Manipulating Bitcoin Price

0

The man who hacked an X account associated with the U.S. Securities and Exchange Commission (SEC) last year has been sentenced to 14 months behind bars for manipulating the value of Bitcoin (BTC).

In a new press release, the United States Attorney’s Office for the District of Columbia says that Eric Council Jr. – a 26-year-old man from Alabama – has been sentenced to over a year in prison for his role in the exploit, when he and others hacked the X account of the regulator a means of boosting BTC.

Authorities say that Council engaged in “SIM swaps,” or attacks on a mobile phone’s Subscriber Identity Module (SIM), which stores and authenticates unique user data and allows cellular devices to connect to mobile networks.

Prosecutors say that on January 9th, 2024, Council and others SIM-swapped the cell phone of a person associated with the SEC’s official X account to make a fake post and manipulate the price of BTC.

To pull off the scheme, Council created a fake ID card to trick AT&T store employees into giving him a replacement SIM card linked to the victim’s phone line. He then purchased a new iPhone, inserted the new SIM card and proceeded to reset the password of the SEC’s X account and shared the information with his co-conspirators before returning the phone for cash.

One of the crew members subsequently made a fake post using the official SEC account about how the regulatory agency had approved BTC-based exchange-traded funds (ETFs), which at the time were highly anticipated and pending approval.

Following the post, BTC’s price rose by $1,000. However, after the SEC regained control of its account and confirmed that the post was fraudulent, BTC dipped by $2,000.

As stated by US Attorney Jeanine Pirro,

“Schemes of this nature threaten the health and integrity of our market system. SIM swap schemes threaten the financial security of average citizens, financial institutions, and government agencies.”

Follow us on X, Facebook and Telegram

Don’t Miss a Beat – Subscribe to get email alerts delivered directly to your inbox

Check Price Action

Surf The Daily Hodl Mix

&nbsp

Disclaimer: Opinions expressed at The Daily Hodl are not investment advice. Investors should do their due diligence before making any high-risk investments in Bitcoin, cryptocurrency or digital assets. Please be advised that your transfers and trades are at your own risk, and any losses you may incur are your responsibility. The Daily Hodl does not recommend the buying or selling of any cryptocurrencies or digital assets, nor is The Daily Hodl an investment advisor. Please note that The Daily Hodl participates in affiliate marketing.

Generated Image: Midjourney

The post Mastermind Behind SEC SIM Swapping Scheme Sentenced to 14 Months in Prison for Manipulating Bitcoin Price appeared first on The Daily Hodl.

Liquidations on the Rise as Bitcoin (BTC) Pumps and Dumps on Sunday

0

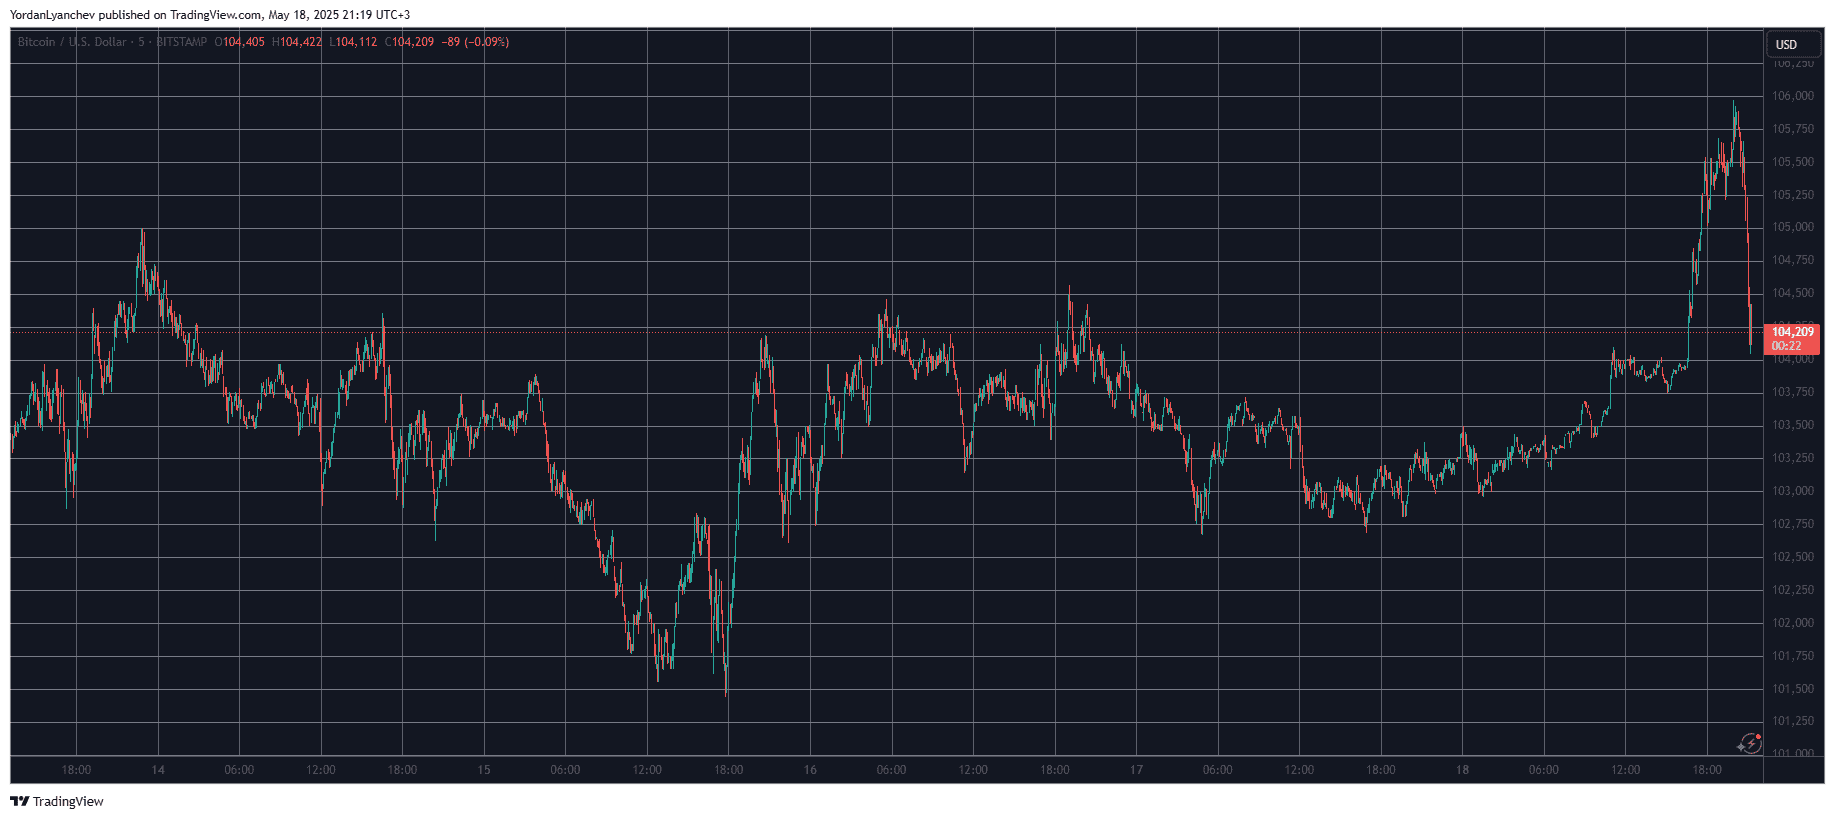
Following a relatively boring Friday and Saturday, bitcoin’s price went on the offensive on Sunday evening and shot up to its highest level since the end of January at $106,000.

However, the bears were quick to step up at this point, and the asset plunged by two grand in an instant.

BTCUSD. Source: TradingView

Recall our Market Watch from this morning, which informed that BTC had returned to familiar ground at around $104,000 after a brief dip below $103,000, which allowed an anonymous whale to open a massive long position worth nearly $400 million on Hyperliquid.

Live data from CoinGlass indicates that the large market participant has closed a portion of his position, which is now worth a more modest $337 million.

This transpired in the past few hours, during which BTC’s price quickly pumped from $104,000 to a multi-month peak at $106,000, where it faced a violent rejection and was pushed south to its starting point within minutes.

The total value of wrecked positions has risen to almost $280 million on a daily scale, with the majority of that taking place in the past 12 hours.

BTC short positions actually have the second-biggest share of the pie, as ETH longs dominate with over $80 million.

Liquidation Heat Map. Source: CoinGlass

More than 90,00 traders have been wrecked in the past day, while the single-largest liquidated position took place on HTX, involved the ETH/USDT pair, and was worth $8.21 million, says CoinGlass.

The post Liquidations on the Rise as Bitcoin (BTC) Pumps and Dumps on Sunday appeared first on CryptoPotato.

Spot Markets Drive Bitcoin to $106K as Coinbase Sees $45M Daily Buying Pressure: Glassnode

0

Bitcoin’s surge to $106,000 earlier this week has been primarily driven by robust spot market demand, with Coinbase seeing net buying pressure of $45 million per day, according to Glassnode’s latest report.

The rally, which began after the king cryptocurrency dipped to just below $75,000 in early April, has been marked by strong accumulation phases, exchange-traded fund (ETF) inflows, and a cooling of sell-side pressure, pointing to sustained bullish momentum despite recent profit-taking by long-term holders.

Spot Demand Outpaces Derivatives

Unlike previous rallies fueled by leveraged speculation, this latest uptrend has been characterized by organic sport market accumulation.

According to the Glassnode report, BTC changed hands heavily in the $93,000 to $95,000 range, which is now acting as a key support level as it coincides with the cost basis of traders who entered the market within the last 155 days.

The price has respected this range amid sideways accumulation, reinforcing the “stair-stepping” structure visible on the Cost Basis Distribution heatmap.

Meanwhile, derivatives markets lagged, with perpetual futures open interest dropping 10%, from 370,000 BTC to 336,000 BTC, possibly indicating a substantial short squeeze as bears were flushed out.

However, funding rates remain neutral, reflecting a lack of excessive long-side leverage, something which Glassnode’s experts believe is a sign the rally could have more room to run.

Spot Bitcoin ETF inflows also played an important role, peaking at $389 million on April 25 before tapering to around $58 million per day. Coinbase, a preferred exchange for U.S. institutional investors, recorded consistent buying. At the same time, the sell pressure on its global counterpart, Binance, eased from $71 million per day in March to just $9 million, suggesting investors were actively buying the dip.

Long-Term Holders Cash In, But Demand Remains Strong

Despite the rally, long-term Bitcoin holders have started taking profits, as CryptoQuant analyst Avocado Onchain noted in a May 15 report.

According to them, the Binary Coin Days Destroyed (CDD) metric, which tracks dormant coins being moved, has risen to 0.6. While it shows these holders are offloading dormant BTC for profit, the metric has not reached the 0.8 zone seen during previous bull market highs.

Glassnode’s own data corroborates this trend, showing that short-term holder (STH) realized profits are spiking to nearly +3 standard deviations above the 90-day average. However, the analytics firm cautioned that profit-taking has not yet reached exhaustion levels, since in past rallies, higher deviations closer to +5 were needed to deplete demand and mark local tops.

The post Spot Markets Drive Bitcoin to $106K as Coinbase Sees $45M Daily Buying Pressure: Glassnode appeared first on CryptoPotato.

Bitcoin Bulls Face Make-Or-Break Moment At $106,500 Resistance – Details

0

Popular digital asset analyst with X handle Crypto Patel has stated that Bitcoin is currently retesting a crucial price resistance at the $106,500 price region. Based on the asset’s performance at this level, BTC investors could expect a bullish price continuation or a significant price pullback.

After a brief rise above $105,000 on May 12, Bitcoin has remained range-bound, showing no significant price movement since then. However, bullish sentiments remain high as demonstrated by US BTC spot ETFs scooping another almost $2 billion in net weekly investments.

Bitcoin At A Crossroads: Can Bulls Push To $120k — Or Does A Fall To $75k Await?

In an X post on May 16, Crypto Patel shares a simple technical analysis on Bitcoin price movement, highlighting the present major support and resistance levels. According to the analyst, Bitcoin’s most recent price gain shows the asset is retesting a critical resistance around the $106,500 price region.

Notably, this resistance band has proved effective in inducing price rejections in December and January. If Bitcoin bulls can command sufficient market demand to subdue this price barrier, Crypto Patel projects the premier cryptocurrency will sustain its current uptrend with an initial price target set at $120,000.

Bitcoin

On the other hand, another price rejection could harm current investors’ expectations, as such negative development would force prices below the crucial $90,000 support zone to trade as low as the current market bottom at $75,000. This projected correction hints at a potential 27.1% decline from the present market price despite currently robust bullish sentiments.

Interestingly, the Relative Strength Index (RSI) shows that Bitcoin has recently dipped from the overbought territory, thus supporting predictions of an impending price correction. However, macroeconomic developments such as the 90-day tariff truce between the US and China, and strong levels of institutional investment, boost the potential of a bullish trend continuation.

Bitcoin Price Prediction

At press time, Bitcoin is valued at $103,355 following a 1.62% decline in the last week. However, the asset’s monthly performance reflects a 21.46% gain, signalling most new market entrants are still in profit.

According to the prediction site, CoinCodex, investors are showing a high level of greed as indicated by the Fear & Greed Index at 74. Coincodex analysts are predicting Bitcoin to reach $127,872 in the next five days, followed by a price correction that will return prices to around $111,616.

For long-term investment, the analyst projects Bitcoin to hit a valuation of $155,583 in three months and $148,167 in six months.

Bitcoin

Moody’s Downgrades US Credit Score, Strips Final AAA Rating on Mounting Debt Concerns

0

Moody’s has joined the two other major rating agencies in determining that the US is no longer fit to hold a AAA credit score.

On Friday, Moody’s downgraded America’s credit rating from AAA to AA1 while changing the country’s outlook from negative to stable.

Moody’s attributes the downgrade to the United States’ soaring national debt and interest payment ratios that exceed those of other countries with the same credit rating.

“As deficits and debt have grown, and interest rates have risen, interest payments on government debt have increased markedly.

Without adjustments to taxation and spending, we expect budget flexibility to remain limited, with mandatory spending, including interest expense, projected to rise to around 78% of total spending by 2035 from about 73% in 2024. If the 2017 Tax Cuts and Jobs Act is extended, which is our base case, it will add around $4 trillion to the federal fiscal primary (excluding interest payments) deficit over the next decade.

As a result, we expect federal deficits to widen, reaching nearly 9% of GDP by 2035, up from 6.4% in 2024, driven mainly by increased interest payments on debt, rising entitlement spending, and relatively low revenue generation. We anticipate that the federal debt burden will rise to about 134% of GDP by 2035, compared to 98% in 2024.” 

Moody’s latest decision strips the United States of its final Triple-A credit rating. The downgrade follows earlier moves by other major agencies: in 2011, Standard & Poor’s (S&P) lowered the US’ rating from AAA to AA+ due to concerns over the government’s inability to address rising debt levels. And in 2023, Fitch followed suit, citing persistent budget deficits and political infighting as key drivers of its downgrade.

Follow us on X, Facebook and Telegram

Don’t Miss a Beat – Subscribe to get email alerts delivered directly to your inbox

Check Price Action

Surf The Daily Hodl Mix

&nbsp

Disclaimer: Opinions expressed at The Daily Hodl are not investment advice. Investors should do their due diligence before making any high-risk investments in Bitcoin, cryptocurrency or digital assets. Please be advised that your transfers and trades are at your own risk, and any losses you may incur are your responsibility. The Daily Hodl does not recommend the buying or selling of any cryptocurrencies or digital assets, nor is The Daily Hodl an investment advisor. Please note that The Daily Hodl participates in affiliate marketing.

Generated Image: Midjourney

The post Moody’s Downgrades US Credit Score, Strips Final AAA Rating on Mounting Debt Concerns appeared first on The Daily Hodl.

Bitcoin Must Close Above $107,000 To Confirm Breakout Or Risk Dropping To $98K

0

After a powerful rally earlier this month, Bitcoin’s price action has stalled just above $103,000 and has been caught in a tight consolidation range for over the past week. The daily chart shows consistent resistance just above $107,000, with the latest candles forming in a compressed horizontal band, indicating indecision and low momentum.

This price behavior could be seen as a pause before the next leg higher. However, it could also be a trap that could cause a reversal towards $98,000.

Daily Close Above $107K A Clear Breakout Signal

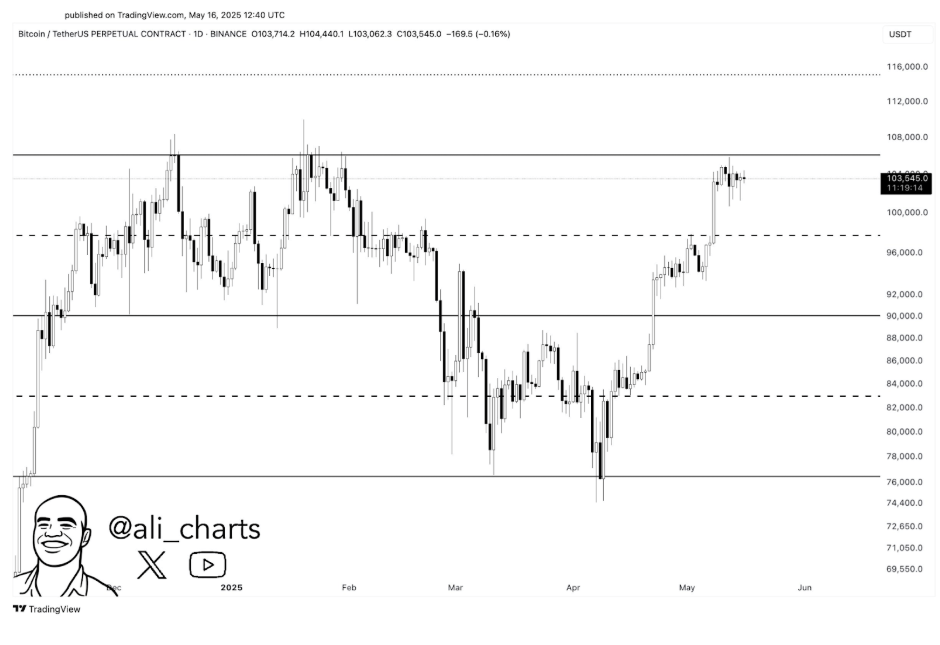
Bitcoin’s current consolidation around the $103,000 price level has dragged on for over a week, and an eventual breakout could happen into any direction. In a recent post on social media platform X, crypto analyst Ali Martinez noted the importance of a daily close above $107,000 for a bullish Bitcoin. 

His chart illustrates that price has approached this threshold multiple times since December 2024 but failed to sustain a close on the daily timeframe. This, in turn, has led to the formation of a horizontal barrier just beneath $108,000. Notably, even Bitcoin’s all-time high of $108,786 on January 20 failed to close above the $107,000 price level on that day.

According to Martinez, a confirmed close above this level could open the door for further upside movement toward new all-time highs. However, until this threshold is decisively cleared, Martinez warns that traders should be cautious and avoid forcing positions.

Image From X: @ali_charts

Potential Bitcoin Trap Setup And Liquidity Sweep To $98K

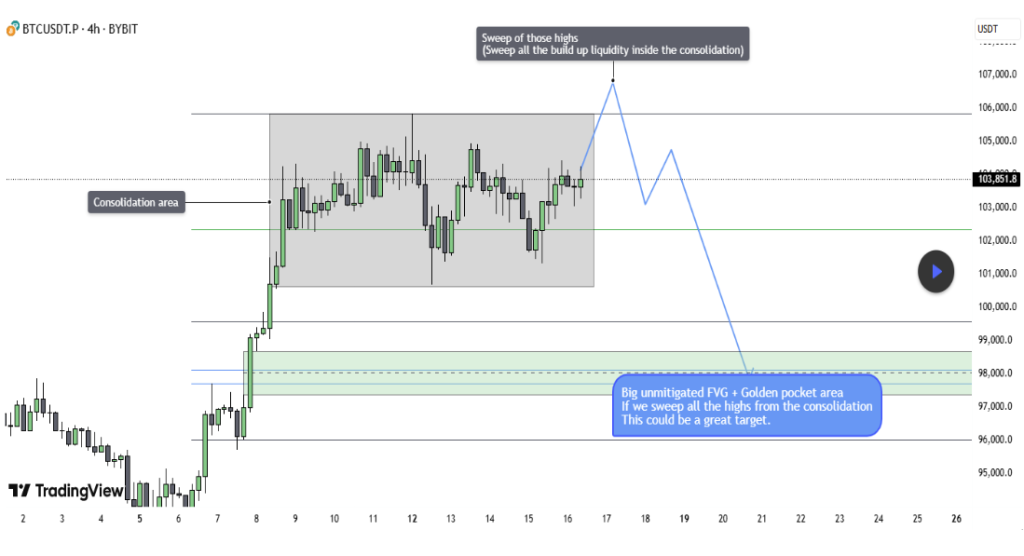
A separate technical breakdown by crypto analyst TehThomas, published on TradingView, presents a far more cautious outlook for Bitcoin. Similarly, the analyst noted that Bitcoin has spent more than eight days locked in a narrow range between roughly $100,000 and $105,800.

According to his liquidity-based framework, this range is likely being used as a trap to invite both long and short traders into premature breakout trades. His 4-hour candlestick timeframe chart shows a clear consolidation block, with price failing to escape either end, and liquidity pooling above $105,800 as well as under $100,000.

TehThomas believes the equal highs near $105,800 are acting as bait for breakout longs. He expects Bitcoin to briefly sweep these highs, only to cause a fast and decisive move downwards into the lower demand zone between $98,000 and $97,500.

This zone, marked as a large unmitigated fair value gap and golden pocket level on his chart, is where he expects the price to react next, once the liquidity on both sides is taken.

Image From TradingView: TehThomas

However, this short setup towards $98,000 would be invalidated if the Bitcoin price manages to hold above $105,800 and shows a continued strong volume and follow-through.

At the time of writing, Bitcoin was trading at $103,914, down by 0.06% in the past 24 hours.

Featured image from Unsplash, chart from TradingView

XRP Has to Break Out of This Range Before Challenging $3: Ripple Price Analysis

0

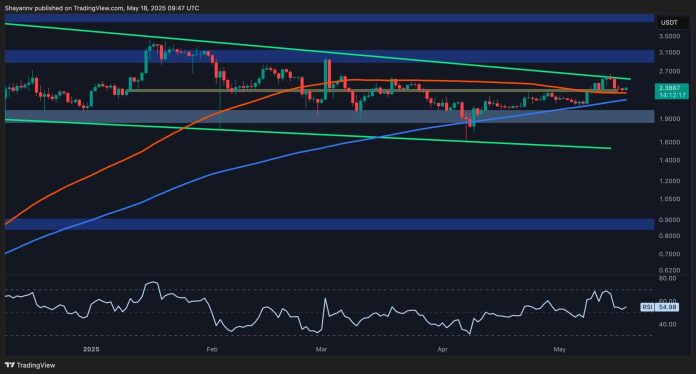
Ripple has reached a decisive price range of $2.3-$2.5, with an impending breakout determining the upcoming trend. A bullish breakout will pave the way for a sustained rally toward the $3.1 range.

XRP Analysis

The Daily Chart

XRP’s recent bullish trend has been halted at the upper boundary of a prolonged descending wedge near the $2.7 level, triggering a bearish retracement. However, the price is now consolidating within a decisive and tight range between $2.3 and $2.5, bounded by the wedge’s apex. This zone has become a critical battleground between buyers and sellers.

The current pullback may also be interpreted as a retest of the recently broken 100 and 200-day moving averages, which could reintroduce demand into the market. A breakout from this narrow range appears imminent, and the direction of this breakout will likely determine XRP’s next major move. A bullish breakout above $2.5 would open the door for a sustained rally toward the $3.1 resistance area.

The 4-Hour Chart

On the lower timeframe, Ripple has maintained a broader bullish structure in recent days, breaking out above the descending wedge pattern. However, the asset faced significant selling pressure around the $2.7 resistance and was swiftly rejected, falling back into the wedge formation. This movement suggests a potential bull trap and false breakout.

Currently, XRP is holding above the key support at $2.3, where buying interest could reemerge. If this level holds, a renewed bullish push toward the $2.7 zone is likely. Still, the market is awaiting a decisive breakout from the $2.3–$2.5 consolidation range.

If the breakout is bullish, the price could quickly surge toward the $3.1 resistance. Conversely, a breakdown below $2.3 might trigger a sharp decline toward the $2 support, especially if accompanied by a short-squeeze or panic selling from overleveraged long positions.

The post XRP Has to Break Out of This Range Before Challenging $3: Ripple Price Analysis appeared first on CryptoPotato.

Ethereum Price Analysis: Can ETH Continue its Run as Major Resistance Levels Approach?

0

Ethereum has experienced a strong upward rally over the past two weeks, pushing from the $1,500s to above $2,600. However, signs of exhaustion are beginning to surface. While higher timeframes remain bullish for now, short-term caution is warranted.

Technical Analysis

By ShayanMarkets

The Daily Chart

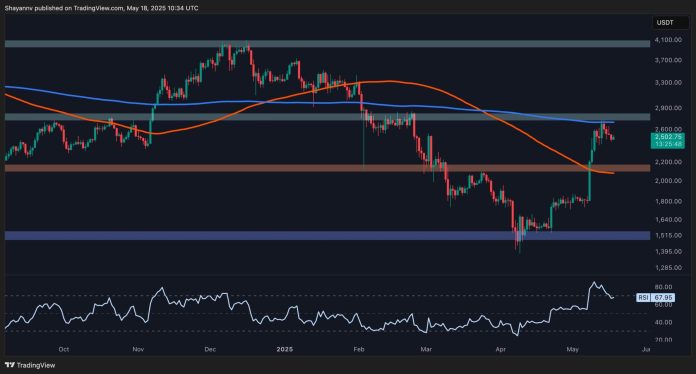
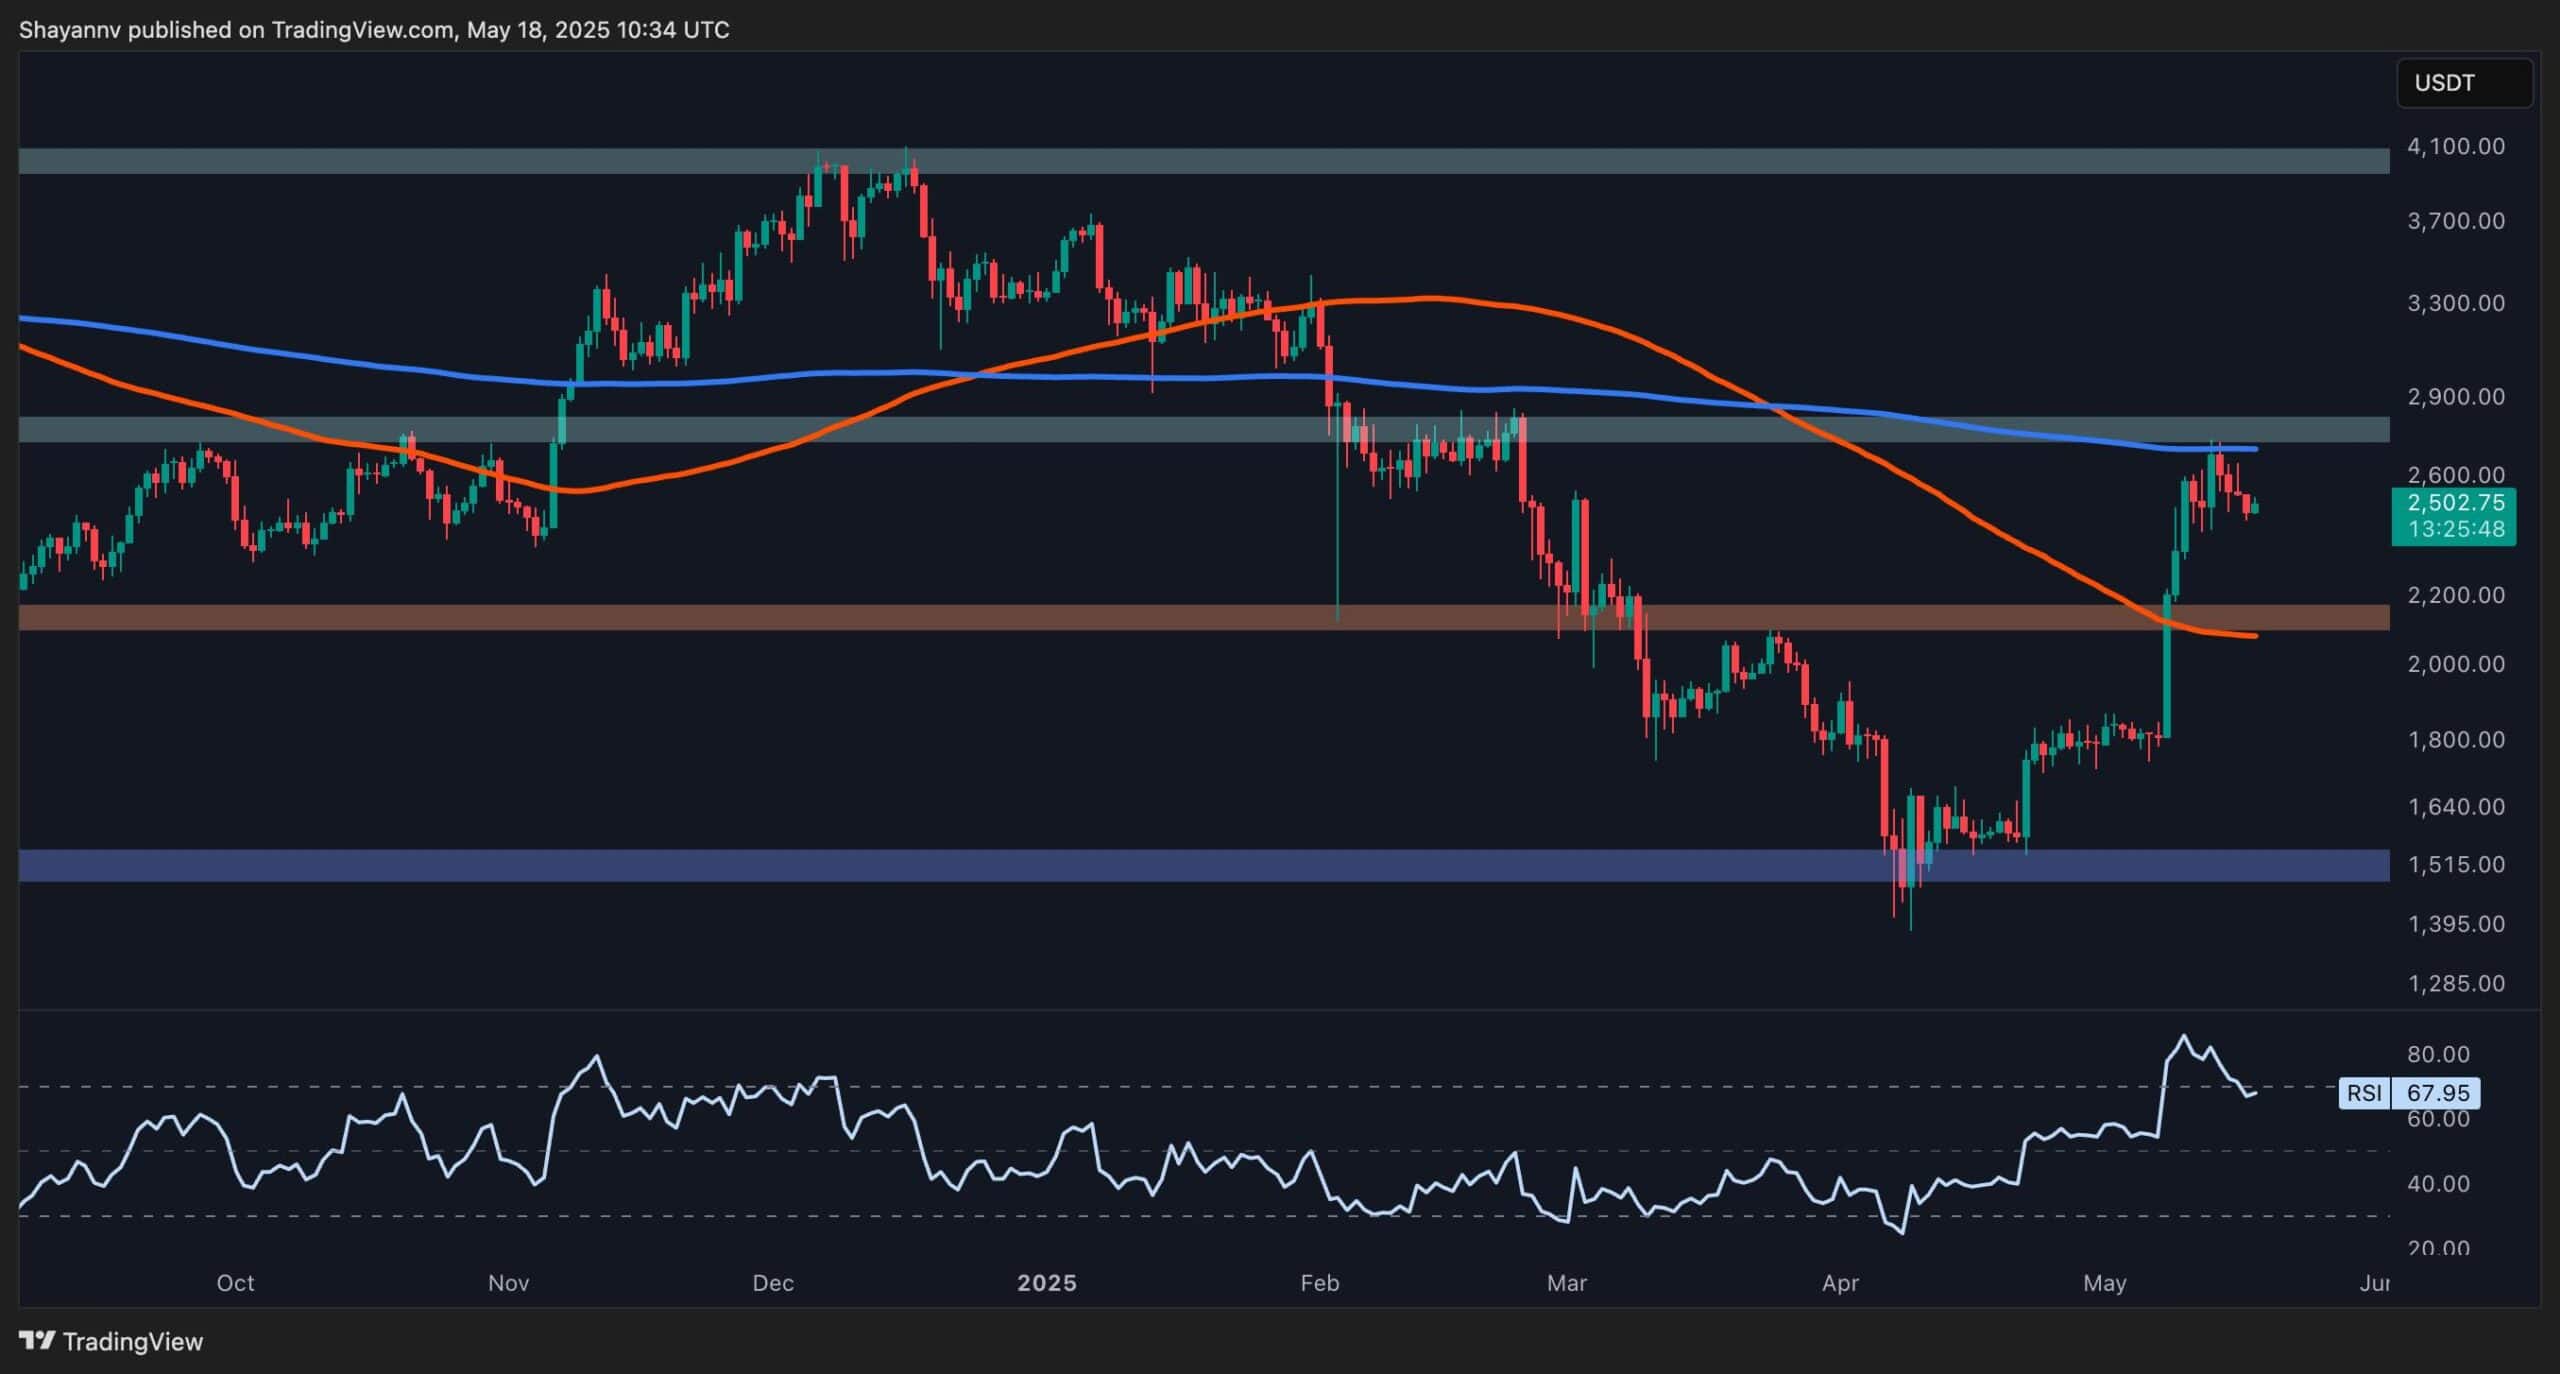
ETH has hit a technical ceiling just under the $2,900 resistance, which aligns closely with the 200-day moving average. This zone previously acted as a major breakdown point in February and is now serving as a supply area. The RSI also recently entered overbought territory, suggesting that momentum is fading as price approaches this resistance.

A rejection from here could lead to a pullback toward the $2,200 support zone and the 100-day MA located near the $2,100 mark. A confirmed breakout above $2,900 would shift the bias back to bullish, with a potential continuation toward the critical $4,000 zone.

The 4-Hour Chart

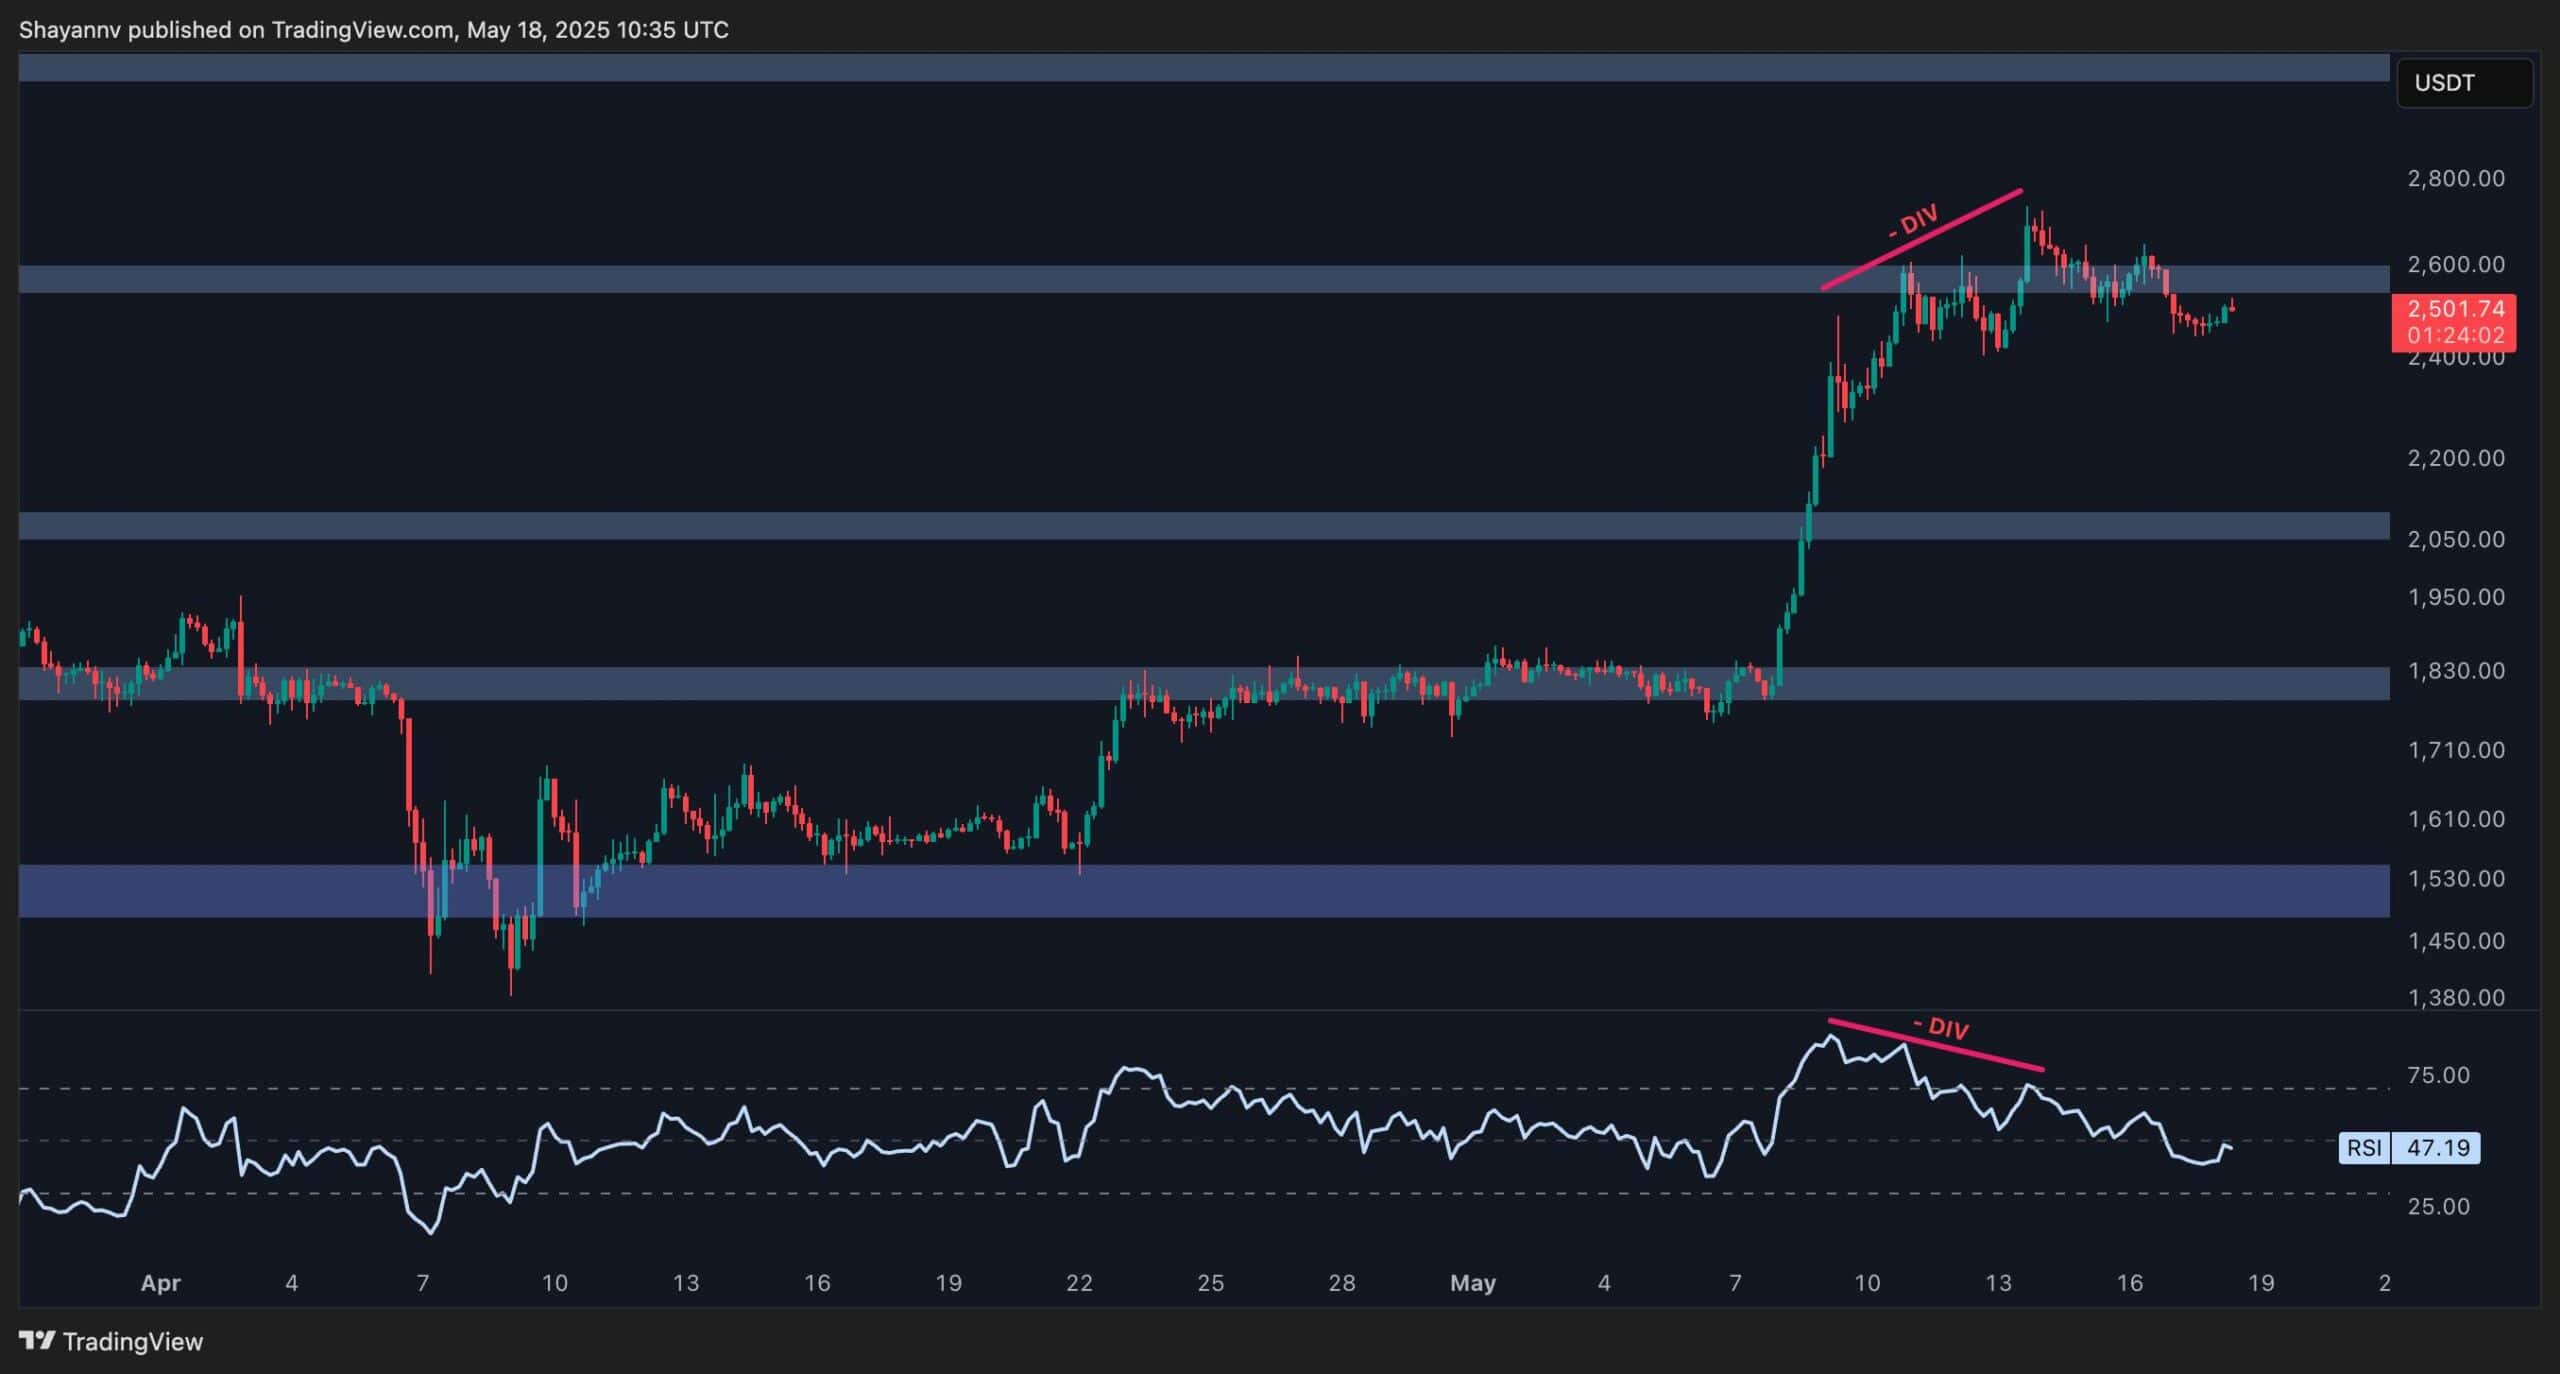
Dropping lower on the 4-hour timeframe, Ethereum is showing signs of weakening momentum. After the explosive move above $2,100, the price has been consolidating within a narrow range near the $2,500–$2,600 region.

A clear bearish divergence is now confirmed on the RSI, with price making higher highs while RSI makes lower highs. This typically indicates a potential correction ahead. If ETH loses the $2,450 support, a retracement toward $2,200 and even $2,050 becomes likely. On the flip side, reclaiming $2,600 with strong volume could invalidate the bearish signals and open the path for a run at the $3,000 area.

Sentiment Analysis

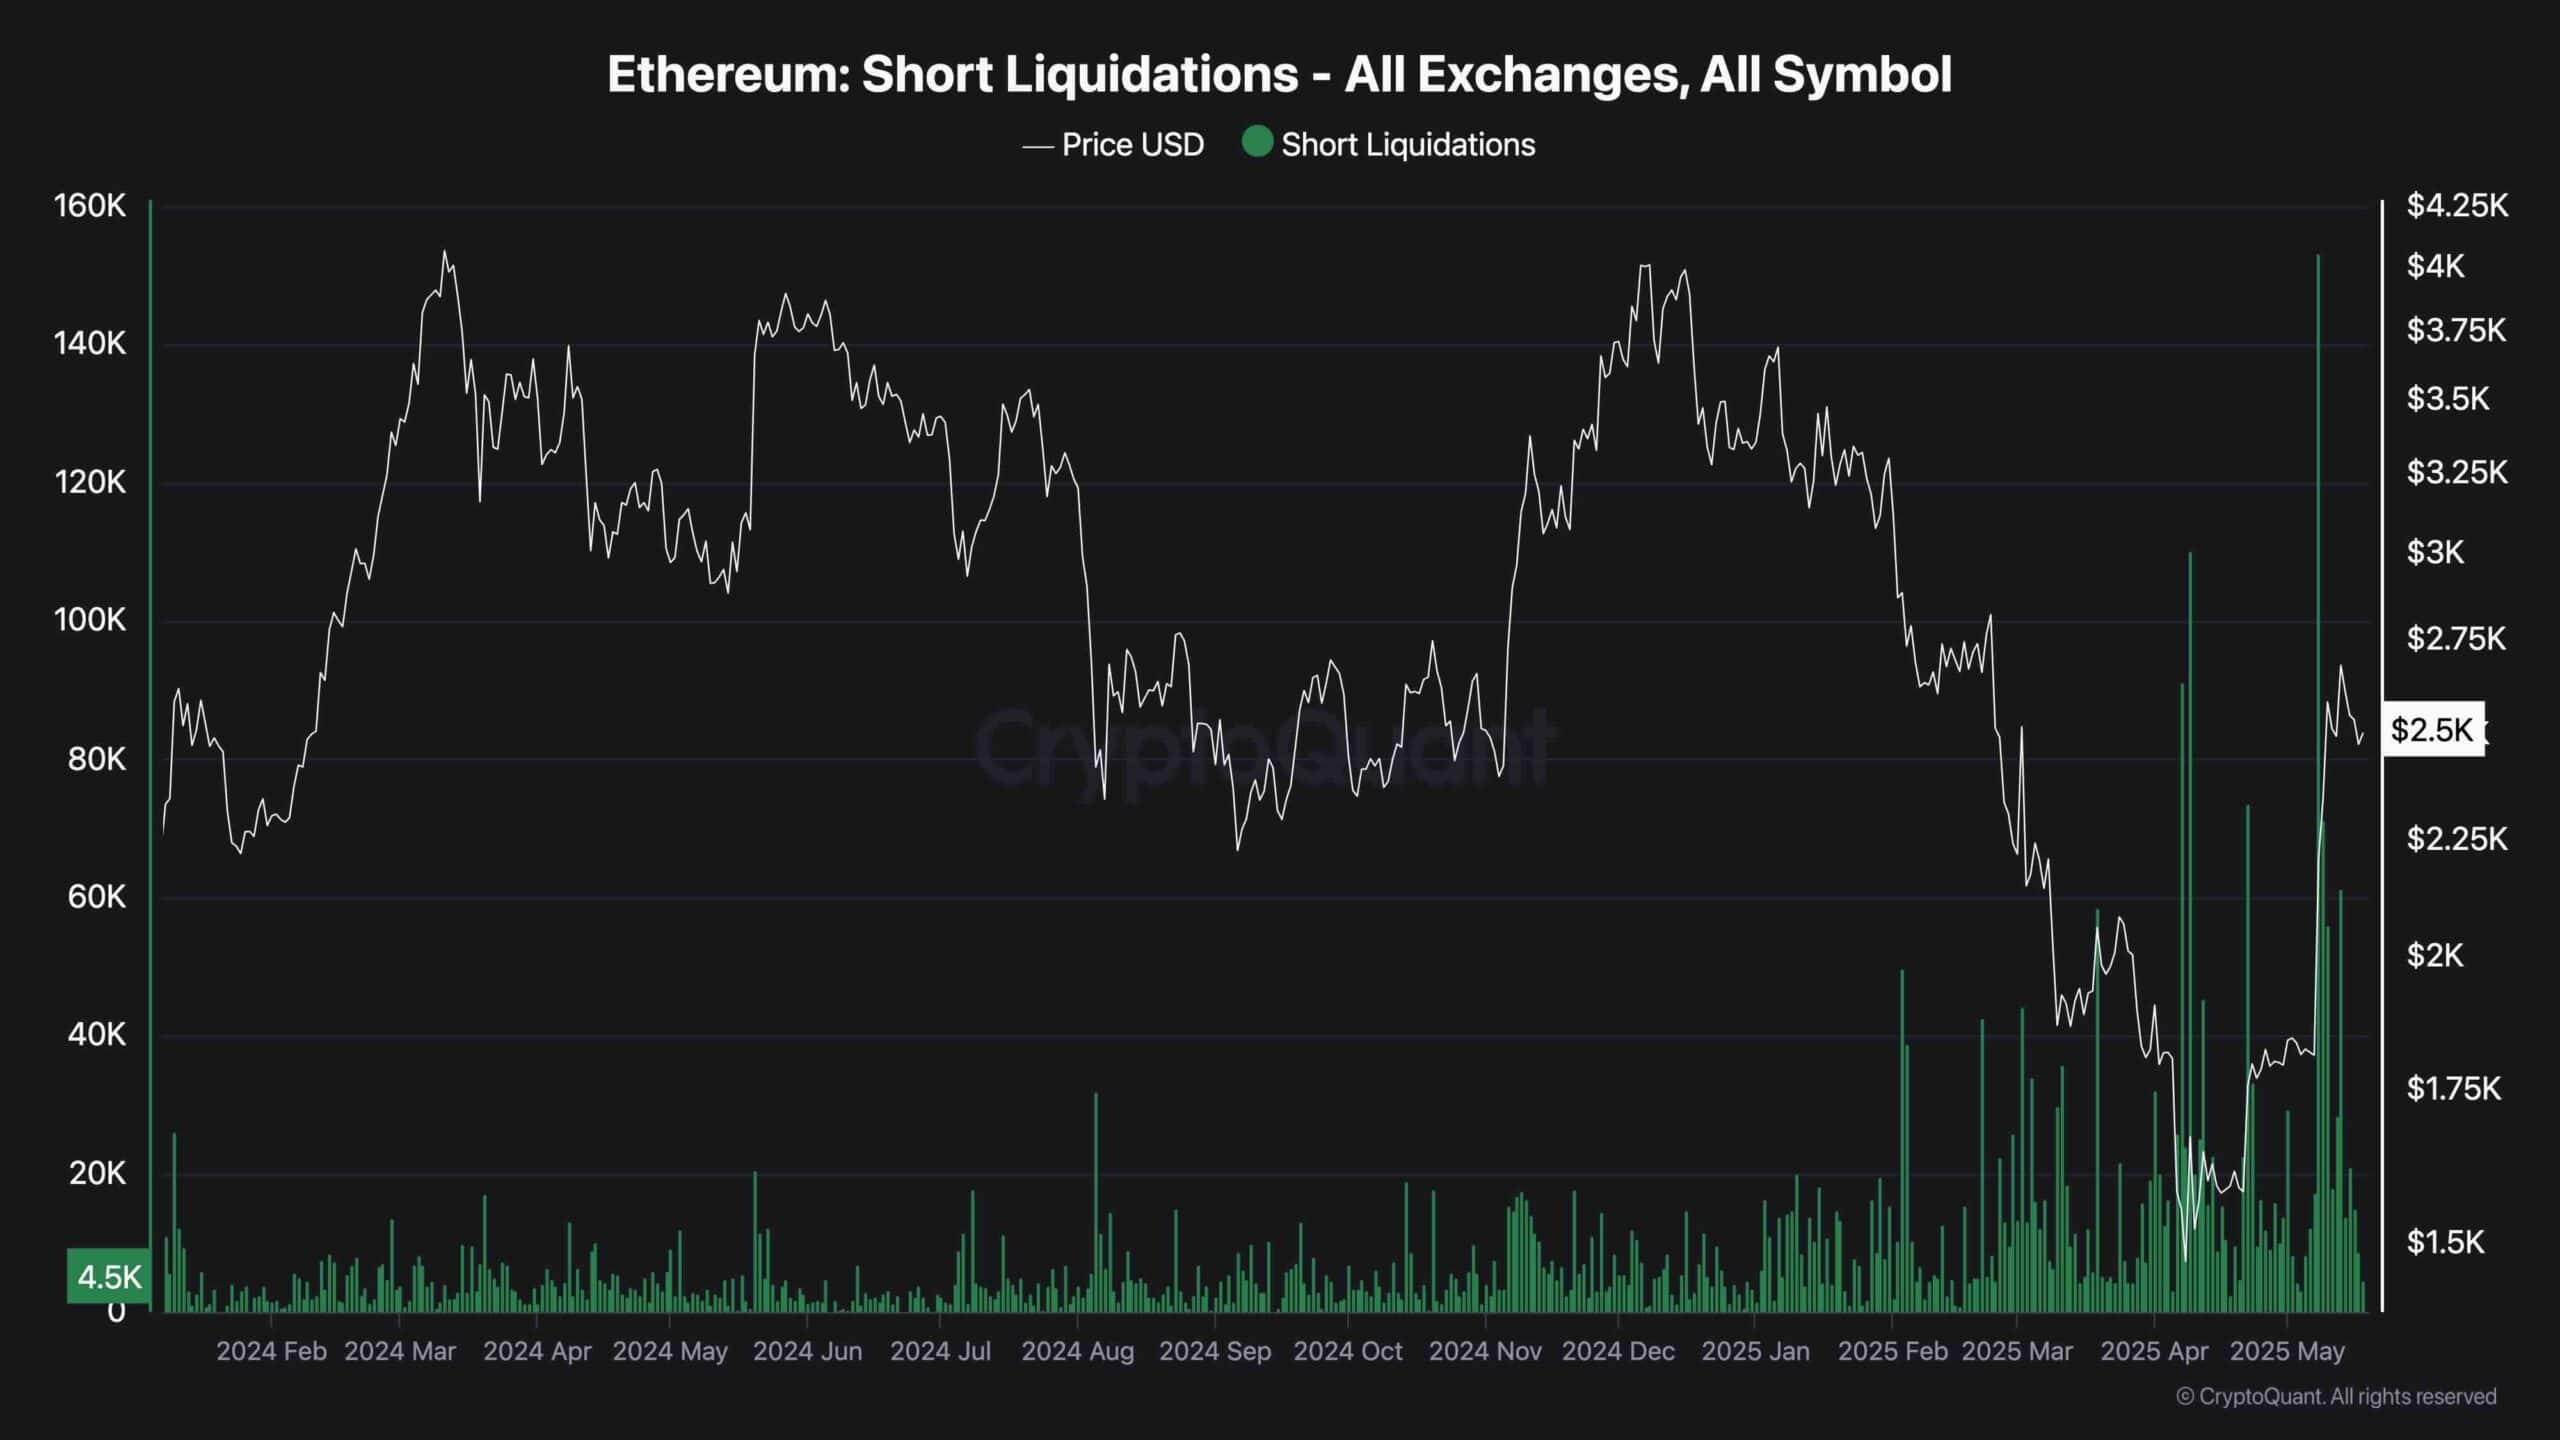
The recent rally triggered a sharp wave of short liquidations, which helped fuel the aggressive price surge. As seen in the short liquidation chart, the largest liquidations occurred near $2,400–$2,600, signaling a large portion of sellers were forced out of the market. This typically leads to short-term cooling, as the “fuel” for the rally gets exhausted.

The liquidation chart shows a clear uptick in forced closures over the past week, aligning with Ethereum’s breakout. These spikes often mark local tops, as the removal of excessive short exposure removes the momentum driver. With liquidations now tapering off, the price may struggle to push higher without fresh demand entering the market. This context reinforces the idea that ETH could consolidate or correct before any meaningful continuation.


The post Ethereum Price Analysis: Can ETH Continue its Run as Major Resistance Levels Approach? appeared first on CryptoPotato.

Bitcoin Price Analysis: Is BTC’s Consolidation Phase Nearing Its End?

0

Bitcoin has continued consolidating below the critical $108K resistance range, signaling a state of equilibrium between buyers and sellers. Nevertheless, the price is likely to initiate a fresh rally once the current corrective consolidation phase concludes.

Technical Analysis

The Daily Chart

Bitcoin remains in a consolidation phase after failing to reclaim the key $108K resistance zone. This price behavior suggests that profit-taking is occurring at this crucial level, increasing selling pressure and triggering a mild retracement. However, Bitcoin still exhibits strong bullish momentum, evidenced by its recent impulsive moves toward this resistance.

As such, once the ongoing consolidation ends, a renewed bullish surge is expected. The price may retrace further toward the key $98K–$100K support range, where new demand is likely to enter and fuel the next rally. This could pave the way for a fresh attempt at a new all-time high in the mid-term.

The 4-Hour Chart

In the 4-hour timeframe, BTC continues to trade within a short-term ascending channel, forming higher highs and higher lows—an indication of a bullish structure. The recent consolidation has led to a pullback toward the channel’s lower boundary at $100K, a major psychological support level.

If this support holds, a rapid rebound toward the $109K ATH appears likely. However, if the price breaks below the channel, the consolidation could extend further, with a decline toward the $98K support range becoming the probable scenario.

Ultimately, Bitcoin’s next move hinges on how the price behaves around the ascending channel’s lower boundary.

On-chain Analysis

Bitcoin’s interaction with the Realized Price of long-term holders’ UTXOs has historically served as a reliable indicator of market direction, as it reflects the average acquisition cost of these key investors. This metric often acts as a dynamic support or resistance level.

Currently, Bitcoin has successfully reclaimed the Realized Price of the 3–6 month holder cohort, suggesting that these important market participants are now in overall profit. This development is typically seen as a bullish signal.

However, a short-term corrective retracement toward this level, currently around $98K, remains a likely scenario, as the market consolidates and searches for fresh demand. The $98K zone stands as a critical support range. A strong rebound from this level could confirm it as a solid foundation and potentially ignite a fresh uptrend, aiming for a new all-time high.

The post Bitcoin Price Analysis: Is BTC’s Consolidation Phase Nearing Its End? appeared first on CryptoPotato.

China Dumps $18,900,000,000 in Treasuries as US Government Faces Major Dilemma: Macro Analyst Luke Gromen

0

China sold off billions of dollars worth of US Treasuries between February and March, according to new government data.

An update from the Treasury Department shows China’s US Treasury holdings dropped $18.9 billion in one month, while most other countries increased their holdings.

The data also shows that the UK has overtaken China and is now the second-biggest foreign holder of USTs in the world.

Japan remains the biggest holder of USTs in the world, currently holding $1.13 trillion, down from $1.16 trillion a year prior.

Macro investor Luke Gromen warns that the countries buying more USTs won’t be able to simultaneously buy more American-manufactured goods, further hurting America’s trade deficit that President Trump has promised to address.

Says Gromen,

“Foreign UST holdings rose $133 billion Mar vs. Feb.

UK, Caymans, and Canada were $86 billion of that $133 billion; China sold $19 billion.

UK surpassed China as the 2nd biggest US foreign creditor for 1st time ever in March.

Cayman Islands (pop. ~73,000) is now the fourth biggest US foreign creditor at $455 billion…

How are they going to buy both USTs and more goods from America going forward?”

Analysts reportedly told Reuters that Chinese holdings of USTs have been in a downward trajectory since 2018, even though foreign holdings of Treasuries surged to an all-time high of $9.05 trillion in March.

Follow us on X, Facebook and Telegram

Don’t Miss a Beat – Subscribe to get email alerts delivered directly to your inbox

Check Price Action

Surf The Daily Hodl Mix

&nbsp

Disclaimer: Opinions expressed at The Daily Hodl are not investment advice. Investors should do their due diligence before making any high-risk investments in Bitcoin, cryptocurrency or digital assets. Please be advised that your transfers and trades are at your own risk, and any losses you may incur are your responsibility. The Daily Hodl does not recommend the buying or selling of any cryptocurrencies or digital assets, nor is The Daily Hodl an investment advisor. Please note that The Daily Hodl participates in affiliate marketing.

Generated Image: Midjourney

The post China Dumps $18,900,000,000 in Treasuries as US Government Faces Major Dilemma: Macro Analyst Luke Gromen appeared first on The Daily Hodl.

Translate »