Friday, November 21, 2025

Advertise

spot_img
Home Blog Page 1026

Yala Brings Cross-Chain Bitcoin Liquidity to Solana

0

[PRESS RELEASE – Singapore, Singapore, May 19th, 2025]

Yala has announced its official launch on the Solana blockchain, marking a key development in its initiative to integrate Bitcoin liquidity into decentralized finance. This launch signifies a strategic expansion aimed at enabling Bitcoin to function beyond its traditional role as a store of value, facilitating its use across DeFi ecosystems.

By operating on Solana, Yala allows BTC holders to engage with one of the industry’s most efficient and high-performance blockchain networks. Solana’s infrastructure is known for its speed and scalability, offering an ideal environment for new decentralized financial applications that utilize Bitcoin liquidity.

This integration allows for:

  • Instant, low-fee access to BTC-backed liquidity
  • Composability with native Solana DeFi protocols
  • Participation in yield-generating strategies tied to both digital and real-world assets

Bitcoin holders can retain their BTC exposure while utilizing decentralized applications, without needing to convert or move out of the Bitcoin economy.

Supported by the Solana Foundation

This collaboration is designed to enhance adoption by:

  • Enhancing cross-ecosystem compatibility
  • Driving technical integration and developer engagement through dedicated campaigns

The support underscores a mutual goal of bridging Bitcoin liquidity into scalable, cross-chain decentralized infrastructure.

Broader Vision for BTC Utility

The Solana deployment is the initial phase of Yala’s broader cross-chain roadmap. Over the coming weeks, Yala will introduce several initiatives, including liquidity provider incentives, partnerships with Solana-native protocols, and community-driven engagement programs.

Yala’s core objective is to position Bitcoin as a foundational liquidity asset within DeFi. By enabling cross-chain utility, Yala aims to expand the use cases for BTC in areas such as lending, yield generation, and real-world asset markets, while preserving the core principles of Bitcoin’s security and decentralization.

About Yala

Yala is developing a liquidity infrastructure to unlock the underutilized yield potential of Bitcoin across decentralized and real-world finance. Through BTC deposits, users can access flexible liquidity and tap into opportunities across multiple protocols and ecosystems.

For more information, users can visit www.yala.org or follow Yala on X at @yalaorg

The post Yala Brings Cross-Chain Bitcoin Liquidity to Solana appeared first on CryptoPotato.

Bitcoin’s Fate May Be Sealed On June 9, Analyst Warns

0

Bitcoin spent the European trading hours changing hands near $103,000 after Sunday night’s failed attempt to clear $107,100. The pull-back has done little to dent the conviction of market technician Dr Cat (@DoctorCatX), who argues that the decisive battleground is still three weeks away: the weekly close of 9 June, when the Tenkan-sen is projected to cross above the Kijun-sen on the Ichimoku chart.

What This Means For Bitcoin Price

In a post on X published on May 19, the analyst reminded followers that “some people don’t understand the concept of time-frames,” adding that “while now we have a clear rejection with volume, a lot of people decided to get scared … on the first red 4h candle which even if red, didn’t break support.” He framed the current setback as routine consolidation: “Since tomorrow ~99.9K is a super-strong support,” he wrote, identifying the high-liquidity pocket between $98,900 and $100,200 as an area that is “most likely” to be “bought up pretty quickly and decisively” should spot bids be tested.

The crux of Dr Cat’s argument lies in the interaction of the fast-moving Tenkan-sen and the medium-term Kijun-sen on the weekly chart. An upward cross of the former above the latter—sometimes colloquially dubbed a “TK golden cross”—carries weight among Ichimoku practitioners because it signals that near-term momentum has finally overwhelmed the baseline trend.

Bitcoin price analysis

What makes the 9 June close especially delicate is the tightness of the current range. Dr Cat concedes that “it’s unclear which will come first, $99,000 or $109,000—and that doesn’t really matter,” but he is categorical that “any deeper retrace below $98,000 is very unlikely.” The rising Kijun-sen, itself a 26-period mid-point, has in effect ratcheted support higher with every week of sideways trade.

Macro-sensitive traders will also be working around the publication of the May US Consumer Price Index on June 11—two days after the anticipated TK cross—and the Federal Reserve’s rate-setting meeting on June 17-18. With real-yield expectations still dominating risk-asset positioning, any upside surprise in core inflation could delay the confirmation of bullish chart patterns—or intensify them if the data land dovish.

For now, the market remains range-bound. As long as $99,000 holds on a closing basis and the Chikou-span (lagging line) stays above price, Dr Cat sees little reason to abandon an all-time-high thesis. “If by the time of the cross the price is still holding above Tenkan Sen … if ATH is not seen by then, it should be seen pretty much immediately,” he wrote.

Whether that confidence will survive the macro calendar is another question. What is clear is that both discretionary traders and systematic funds are marking 9 June as the moment the chart either validates the 2025 bull cycle—or postpones it once more.

At press time, BTC traded at $103,721.

Bitcoin price

XRP Price Eyes Gains, But Technicals Suggest Upsides May Be Limited

0

XRP price started a fresh decline below the $2.350 zone. The price is now recovering losses and might face hurdles near the $2.420 zone.

  • XRP price started a fresh decline below the $2.450 zone.
  • The price is now trading above $2.350 and the 100-hourly Simple Moving Average.
  • There is a connecting bearish trend line forming with resistance at $2.40 on the hourly chart of the XRP/USD pair (data source from Kraken).
  • The pair might start another decline if it stays below the $2.450 resistance.

XRP Price Faces Hurdles

XRP price attempted a fresh decline below the $2.450 zone, unlike Bitcoin and Ethereum. There was a move below the $2.40 and $2.350 levels. The price even tested the $2.2850 zone.

A low was formed at $2.2848 and the price is now attempting to recover. There was a move above the $2.32 and $2.350 levels. The price surpassed the 50% Fib retracement level of the downward move from the $2.449 swing high to the $2.848 high.

However, the price now faces hurdles near the $2.40 level. The price is now trading above $2.35 and the 100-hourly Simple Moving Average. On the upside, the price might face resistance near the $2.40 level. There is also a connecting bearish trend line forming with resistance at $2.40 on the hourly chart of the XRP/USD pair.

The first major resistance is near the $2.420 level. It is near the 76.4% Fib retracement level of the downward move from the $2.449 swing high to the $2.848 high.

XRP Price

The next resistance is $2.50. A clear move above the $2.50 resistance might send the price toward the $2.60 resistance. Any more gains might send the price toward the $2.650 resistance or even $2.680 in the near term. The next major hurdle for the bulls might be $2.80.

Another Decline?

If XRP fails to clear the $2.420 resistance zone, it could start another decline. Initial support on the downside is near the $2.350 level. The next major support is near the $2.320 level.

If there is a downside break and a close below the $2.320 level, the price might continue to decline toward the $2.20 support. The next major support sits near the $2.120 zone.

Technical Indicators

Hourly MACD – The MACD for XRP/USD is now losing pace in the bearish zone.

Hourly RSI (Relative Strength Index) – The RSI for XRP/USD is now above the 50 level.

Major Support Levels – $2.350 and $2.320.

Major Resistance Levels – $2.40 and $2.420.

Ethereum Sees $205M Weekly Inflows Following Successful Pectra Upgrade

0

For the fifth consecutive week, digital asset investment products attracted inflows, amounting to $785 million. This pushed total inflows for the year to $7.5 billion, eclipsing the previous high of $7.2 billion seen in February. The influx has now erased the $7 billion in outflows from the February-March downturn.

Interestingly, Ethereum stood out with strong performance.

According to the latest edition of CoinShares’ Digital Asset Fund Flows Weekly Report, Ethereum experienced $205 million in inflows last week, bringing its year-to-date total to $575 million. This was indicative of a renewed investor confidence after the Pectra upgrade finally went live on May 7th, following a series of delays, as well as the appointment of co-executive director Tomasz Stańczak.

Bitcoin also saw notable inflows of $557 million, though down from the previous week, possibly influenced by the Federal Reserve’s continued hawkish stance. Meanwhile, short-bitcoin products attracted $5.8 million for the fourth consecutive week, which suggested investor hedging as prices climb.

During the same period, Sui and XRP recorded inflows of $9.3 million and $4.9 million, respectively, while Cardano and Chainlink posted smaller inflows of $0.5 million and $0.2 million. On the other hand, Solana witnessed $0.89 million in outflows, and multi-asset products saw a larger $2.9 million in withdrawals.

Regional investor sentiment showed clear divisions. The US, for one, saw strong weekly inflows of $681 million, with Germany and Hong Kong contributing $86.3 million and $24.2 million, marking Hong Kong’s largest since November 2024. Australia and Switzerland followed with modest inflows of $13.5 million and $2.7 million, respectively.

However, sentiment soured in Sweden, Canada, and Brazil, which recorded outflows of $16.3 million, $13.5 million, and $3.9 million over the past week, respectively.

The post Ethereum Sees $205M Weekly Inflows Following Successful Pectra Upgrade appeared first on CryptoPotato.

Analyst Drops Dogecoin Bombshell: 174% Surge To $0.65 In Sight

0

Dogecoin’s price took a hit this week after a strong run in recent weeks. It fell from $0.25 down to about $0.21. Traders saw a brief bounce above $0.23 around May 17–18, but that did not last.

As of today, DOGE sits near $0.21, marking a 10% weekly drop. Investors are watching the bigger picture, hoping long‑term signals point to a renewed uptrend.

Analyst Maintains Bullish Outlook

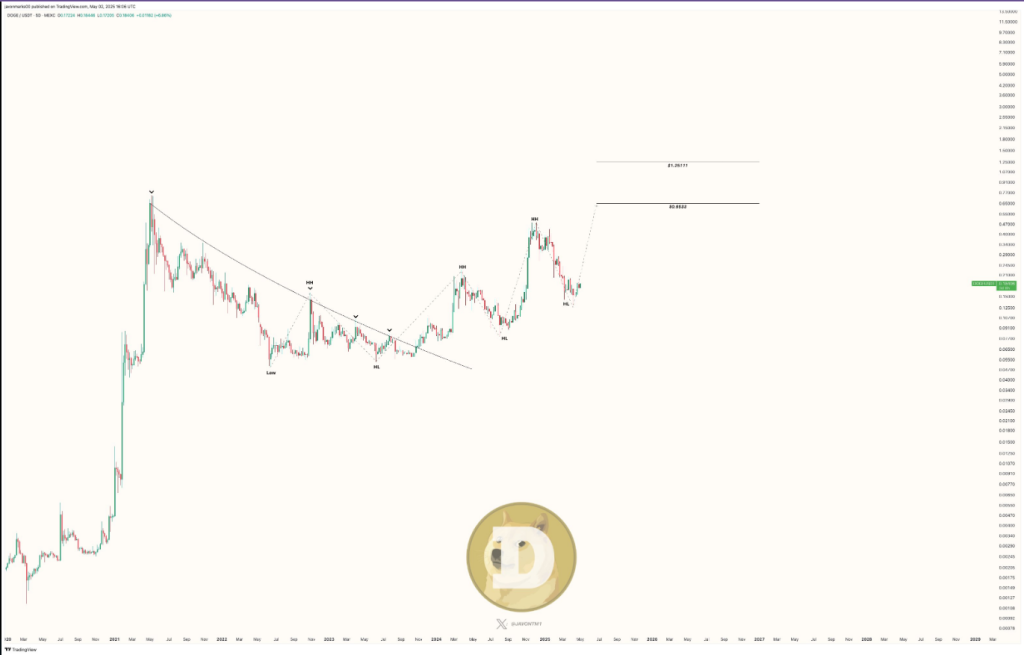
According to analyst Javon Marks, a key trendline gave way in late 2023. This line had capped Dogecoin since its $0.70 peak. He says the break ushered in higher highs and higher lows.

A fresh low near $0.15 has held so far. Based on this view, he kept his $0.65 target, which would mean a 200% gain from $0.21. Marks also mentioned $0.74 and $1.25 as possible future milestones.

Resistance Levels Remain Key Barrier

Based on reports from market watcher Ali Martinez, the $0.25–$0.26 range is a major hurdle. That zone worked as support in December 2024 but flipped to resistance in early 2025.

Since then, the meme coin has tried and failed to push past it. In February, it hit $0.28 before reversing to below $0.15. A March rally saw a move above $0.19 but stopped short again.

The most recent test in May peaked at $0.24 before closing at $0.22. Traders will be looking for a clear close above $0.26 to signal new momentum.


On‑Chain Activity Sees Strong Uptick

Based on latest data, wallet activity has jumped sharply. New addresses grew by over 100% in the last seven days. Active addresses climbed by 110%.

Even zero‑balance addresses rose by 155%, which often hints at fresh participation or address cleanup. Higher on‑chain counts don’t always mean a price rise, but they do show more users are logging transactions again.

Stretch Targets Face Big Hurdles

Dogecoin’s long‑term goals may sound exciting, but getting there won’t be simple. A move to $0.6533 or beyond requires first holding above $0.26. Then it must break $0.28 with real volume behind it.

Big price swings could scare some holders into booking profits. Even if the chart lines line up, outside events like social media buzz or exchange listings may be needed to push DOGE past $0.30.

In the short term, traders will watch whether DOGE can reclaim $0.25 and hold it for a few days. If that happens, the higher‑low pattern stays intact. If it falls back below $0.21, the setup could collapse and open the door to further losses.

For now, the coin sits in a tug‑of‑war between bullish chart fans and those who see more downside.

Featured image from Unsplash, chart from TradingView

Ethereum Price Flashes Bullish Signal, But Can It Power Through Obstacles?

0

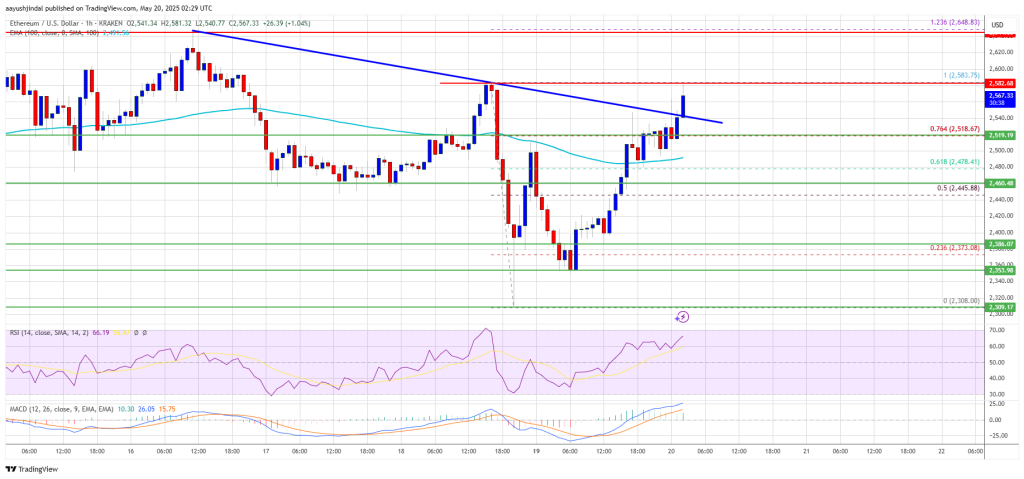
Ethereum price found support at $2,320 and started a fresh increase. ETH is now rising and might aim for a move above the $2,650 resistance zone.

  • Ethereum started a decent increase above the $2,450 and $2,500 levels.
  • The price is trading above $2,500 and the 100-hourly Simple Moving Average.
  • There was a break above a connecting bearish trend line with resistance at $2,530 on the hourly chart of ETH/USD (data feed via Kraken).
  • The pair could gain strength if it clears the $2,650 resistance in the near term.

Ethereum Price Regains Traction

Ethereum price started a downside correction below the $2,450 level, unlike Bitcoin. ETH traded below the $2,400 and $2,350 support levels. However, the bulls were active near the $2,300 zone.

A low was formed at $2,308 and the price started a fresh increase. There was a move above the $2,450 and $2,500 levels. The price surpassed the 61.8% Fib retracement level of the downward move from the $2,583 swing high to the $2,308 low.

Besides, there was a break above a connecting bearish trend line with resistance at $2,530 on the hourly chart of ETH/USD. Ethereum price is now trading above $2,540 and the 100-hourly Simple Moving Average. The price is also above the 76.4% Fib retracement level of the downward move from the $2,583 swing high to the $2,308 low.

On the upside, the price could face resistance near the $2,580 level. The next key resistance is near the $2,600 level. The first major resistance is near the $2,650 level. A clear move above the $2,650 resistance might send the price toward the $2,720 resistance.

Ethereum Price

An upside break above the $2,720 resistance might call for more gains in the coming sessions. In the stated case, Ether could rise toward the $2,780 resistance zone or even $2,840 in the near term.

Another Decline In ETH?

If Ethereum fails to clear the $2,650 resistance, it could start a fresh decline. Initial support on the downside is near the $2,520 level. The first major support sits near the $2,450 zone.

A clear move below the $2,450 support might push the price toward the $2,420 support. Any more losses might send the price toward the $2,320 support level in the near term. The next key support sits at $2,250.

Technical Indicators

Hourly MACDThe MACD for ETH/USD is gaining momentum in the bullish zone.

Hourly RSIThe RSI for ETH/USD is now above the 50 zone.

Major Support Level – $2,450

Major Resistance Level – $2,650

Bitcoin At $103,000 Relatively Cool Per This Indicator, Quant Says

0

A quant has pointed out how the Mayer Multiple could suggest Bitcoin is still not overheated at $103,000 when compared to past trend.

Bitcoin Mayer Multiple Z-Score Is Still Under Its Mean

In a post on X, quant Frank has talked about how the Mayer Multiple of Bitcoin is looking right now. The “Mayer Multiple” here refers to an indicator that keeps track of the ratio between the BTC spot price and its 200-day moving average (MA). In other words, the metric represents the distance that the asset’s value has from the 200-day MA.

The 200-day MA is a level that’s generally considered as an important boundary between macro bullish and bearish trends in the cryptocurrency, so it can be useful to know how far the coin is from this line.

In the context of the current discussion, the Mayer Multiple itself isn’t of interest, but rather its Z-Score. The Mayer Multiple Z-Score is an oscillator that tracks how much deviation the indicator has from its mean value.

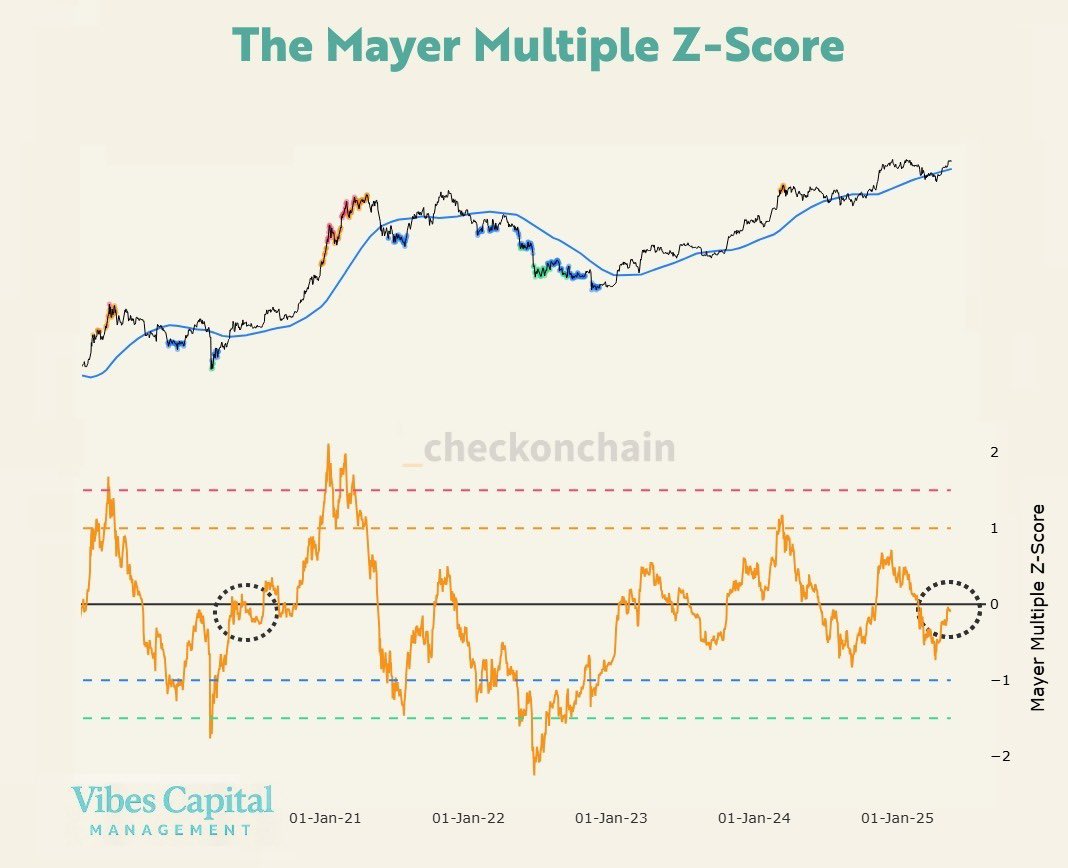
Now, here is the chart for the metric shared by the analyst:

Bitcoin Mayer Multiple Z-Score

As is visible in the top graph, the Bitcoin price saw a dip under the 200-day MA during the earlier market downturn, but with the latest recovery run, it has broken back above the line. It would seem, though, that the asset hasn’t gained too much distance over the level so far, at least in historical context.

And indeed, the Mayer Multiple Z-Score (bottom graph) confirms this, as its value is currently below zero. The zero level corresponds to the all-time mean of the Mayer Multiple. As such, a negative value like the current one suggests the metric is less than the average over history.

More specifically, 53% of all days have witnessed the ratio being higher than the latest level. Based on this, the quant notes that Bitcoin remains relatively cool even at its current $103,000 price.

From the chart, it’s visible that while the Z-Score is still negative, it’s much improved compared to the lows from earlier in the year. It’s possible that if BTC continues its bullish momentum, it will be challenging the zero level soon.

In the current cycle, the Mayer Multiple has been higher than its mean on a few occasions already, with the largest separation occurring in the rally from Q1 2024, where the Z-Score surged above the level corresponding to a standard deviation of 1.

So far, though, the Bitcoin Mayer Multiple hasn’t deviated to the same degree as during the bull run from the first half of 2021. It now remains to be seen whether the metric would heat up to similar levels in this cycle as well or not.

BTC Price

At the time of writing, Bitcoin is trading around $102,700, down 1.5% over the last seven days.

Bitcoin Price Chart

Bitcoin Price Breakout Looms: Charts Signal Run Toward New ATH

0

Bitcoin price started a fresh increase and cleared the $106,000 zone. BTC is now rising and might aim for another increase toward $110,000

  • Bitcoin started a fresh upward move from the $102,000 zone.
  • The price is trading above $105,500 and the 100 hourly Simple moving average.
  • There is a short-term bullish trend line forming with support at $105,800 on the hourly chart of the BTC/USD pair (data feed from Kraken).
  • The pair could gain bullish momentum if it clears the $107,000 resistance.

Bitcoin Price Starts Fresh Surge

Bitcoin price started a fresh increase from the $102,000 support zone. BTC formed a base and was able to clear the $104,200 resistance zone. The bulls pushed the price above $105,000.

There was a clear move above the 50% Fib retracement level of the downward move from the $107,042 swing high to the $102,100 low. It opened the doors for a move above the $106,000 resistance zone.

The current price action is positive since the price settled above the 76.4% Fib retracement level of the downward move from the $107,042 swing high to the $102,100 low. There is also a short-term bullish trend line forming with support at $105,800 on the hourly chart of the BTC/USD pair.

Bitcoin Price

Bitcoin is now trading above $105,500 and the 100 hourly Simple moving average. On the upside, immediate resistance is near the $107,000 level. The first key resistance is near the $107,200 level. The next key resistance could be $107,500. A close above the $107,500 resistance might send the price further higher. In the stated case, the price could rise and test the $108,800 resistance level. Any more gains might send the price toward the $110,000 level and a new all-time high.

Another Drop In BTC?

If Bitcoin fails to rise above the $107,000 resistance zone, it could start another correction. Immediate support on the downside is near the $105,800 level. The first major support is near the $105,000 level.

The next support is now near the $104,200 zone. Any more losses might send the price toward the $103,500 support in the near term. The main support sits at $102,500, below which BTC might gain bearish momentum.

Technical indicators:

Hourly MACD – The MACD is now gaining pace in the bullish zone.

Hourly RSI (Relative Strength Index) – The RSI for BTC/USD is now above the 50 level.

Major Support Levels – $104,200, followed by $103,500.

Major Resistance Levels – $107,000 and $107,500.

Bitcoin Macro Trend Oscillator Shows When To Expect The Price Top

0

Bitcoin’s price action in the past 24 hours has been marked by a highly volatile phase that saw it briefly reach above the $106,000 mark. However, this was followed by a return to consolidation around the $103,000 price level. 

This intense volatility in the past 24 hours suggests that the Bitcoin price still has a long way to go before it reaches a price top. Amid this volatile movement, a new macroeconomic model, the Decode Macro Trend Oscillator (MTO), has pointed out when to expect Bitcoin’s price to top this cycle.

Decode’s Macro Trend Oscillator Model And Its Alignment With Bitcoin Peaks

The Decode Macro Trend Oscillator is a sophisticated tool designed by a Bitcoin analyst known as Decode on the social media platform X. The oscillator aggregates around 40 macroeconomic indicators, ranging from interest rates and global liquidity to industrial production and market volatility, into 17 carefully selected leading metrics.

These are then normalized and visualized as a histogram to produce a cyclical pattern that has historically aligned with Bitcoin’s major tops. A close look at the chart titled Bitcoin Liquid Index on the 1M candlestick timeframe reveals that the light green histogram bars have coincided with each of Bitcoin’s cycle peaks in 2013, 2017, and 2021.

Bitcoin

These peaks are marked by vertical red lines, and the transitions from deep red to green territory on the oscillator appear to offer a visual cue for the end of bearish phases and the onset of price rallies. As of May 2025, the histogram remains in a deep red zone but has begun inching upward, with the most recent bar reading at -11.47, suggesting that macroeconomic conditions may soon start to favor a bigger rally for Bitcoin.

BTC Mode Configuration Fine-Tunes Cycle Top Prediction

Decode’s analysis goes beyond Bitcoin-specific indicators. In one of the accompanying charts of the S&P 500 Index of the 2M timeframe, a long-term comparison is made between the current global environment and the economic backdrop of the late 1980s and early 1990s. Interestingly, Decode’s macro trend oscillator proved reliable in estimating periods of downturns and expansions in both instances. 

In both instances, inflation pressure and declining consumer sentiment pushed the oscillator deep into negative territory for years. However, once the histogram flipped into the green, the economy and prices entered a prolonged phase of expansion.

The third chart offers a more detailed view of Bitcoin’s weekly trend, including an overlay of M2 money supply growth, which is another popular monetary metric. This view highlights how the Macro Trend Oscillator, when switched to a configuration Decode called “Bitcoin Mode,” fine-tunes its sensitivity to metrics that directly impact crypto markets. In this configuration, only a few of the full 17 metrics that best identify Bitcoin cycle tops are used.

As it stands, Bitcoin is still in the negative red histogram zone, even despite its rally in recent months. The first deep green histogram has yet to show up, not to mention the first light green bar that will mark the cycle peak. Based on this setup, the oscillator implies that Bitcoin still has a lot of room to run this cycle, and that a price top is unlikely to arrive in 2025.

At the time of writing, Bitcoin is trading at $103,300.

Bitcoin

Bitcoin Rebound Signals Healthier Bull Market Without Overheating, Analyst Says

0

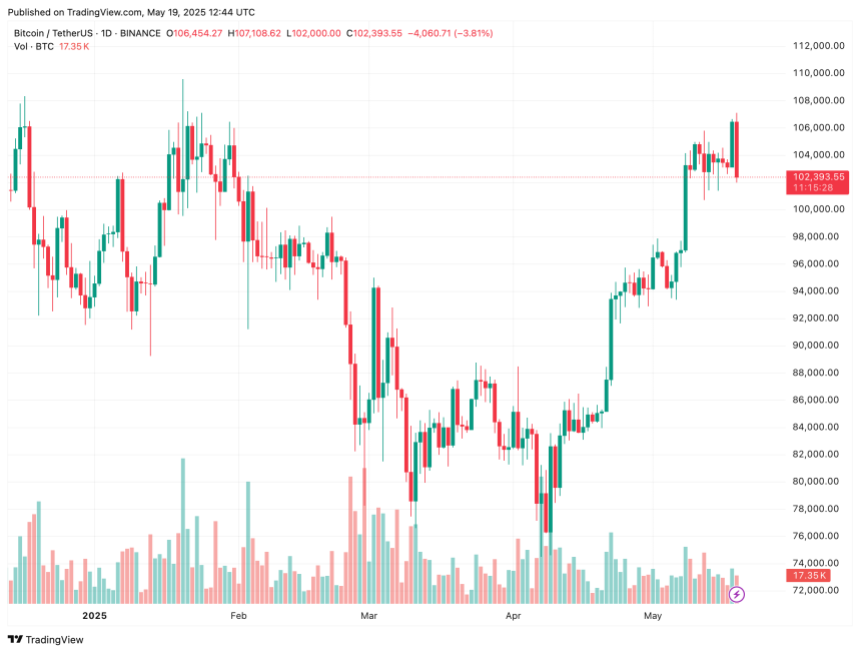
Unlike previous market rallies, the latest rebound in Bitcoin (BTC) – pushing it from a potential cycle low of $74,508 on April 6 to slightly above $100,000 at the time of writing – is characterized by healthier price movement.

Current Bitcoin Rally Not Showing Signs Of Overheating

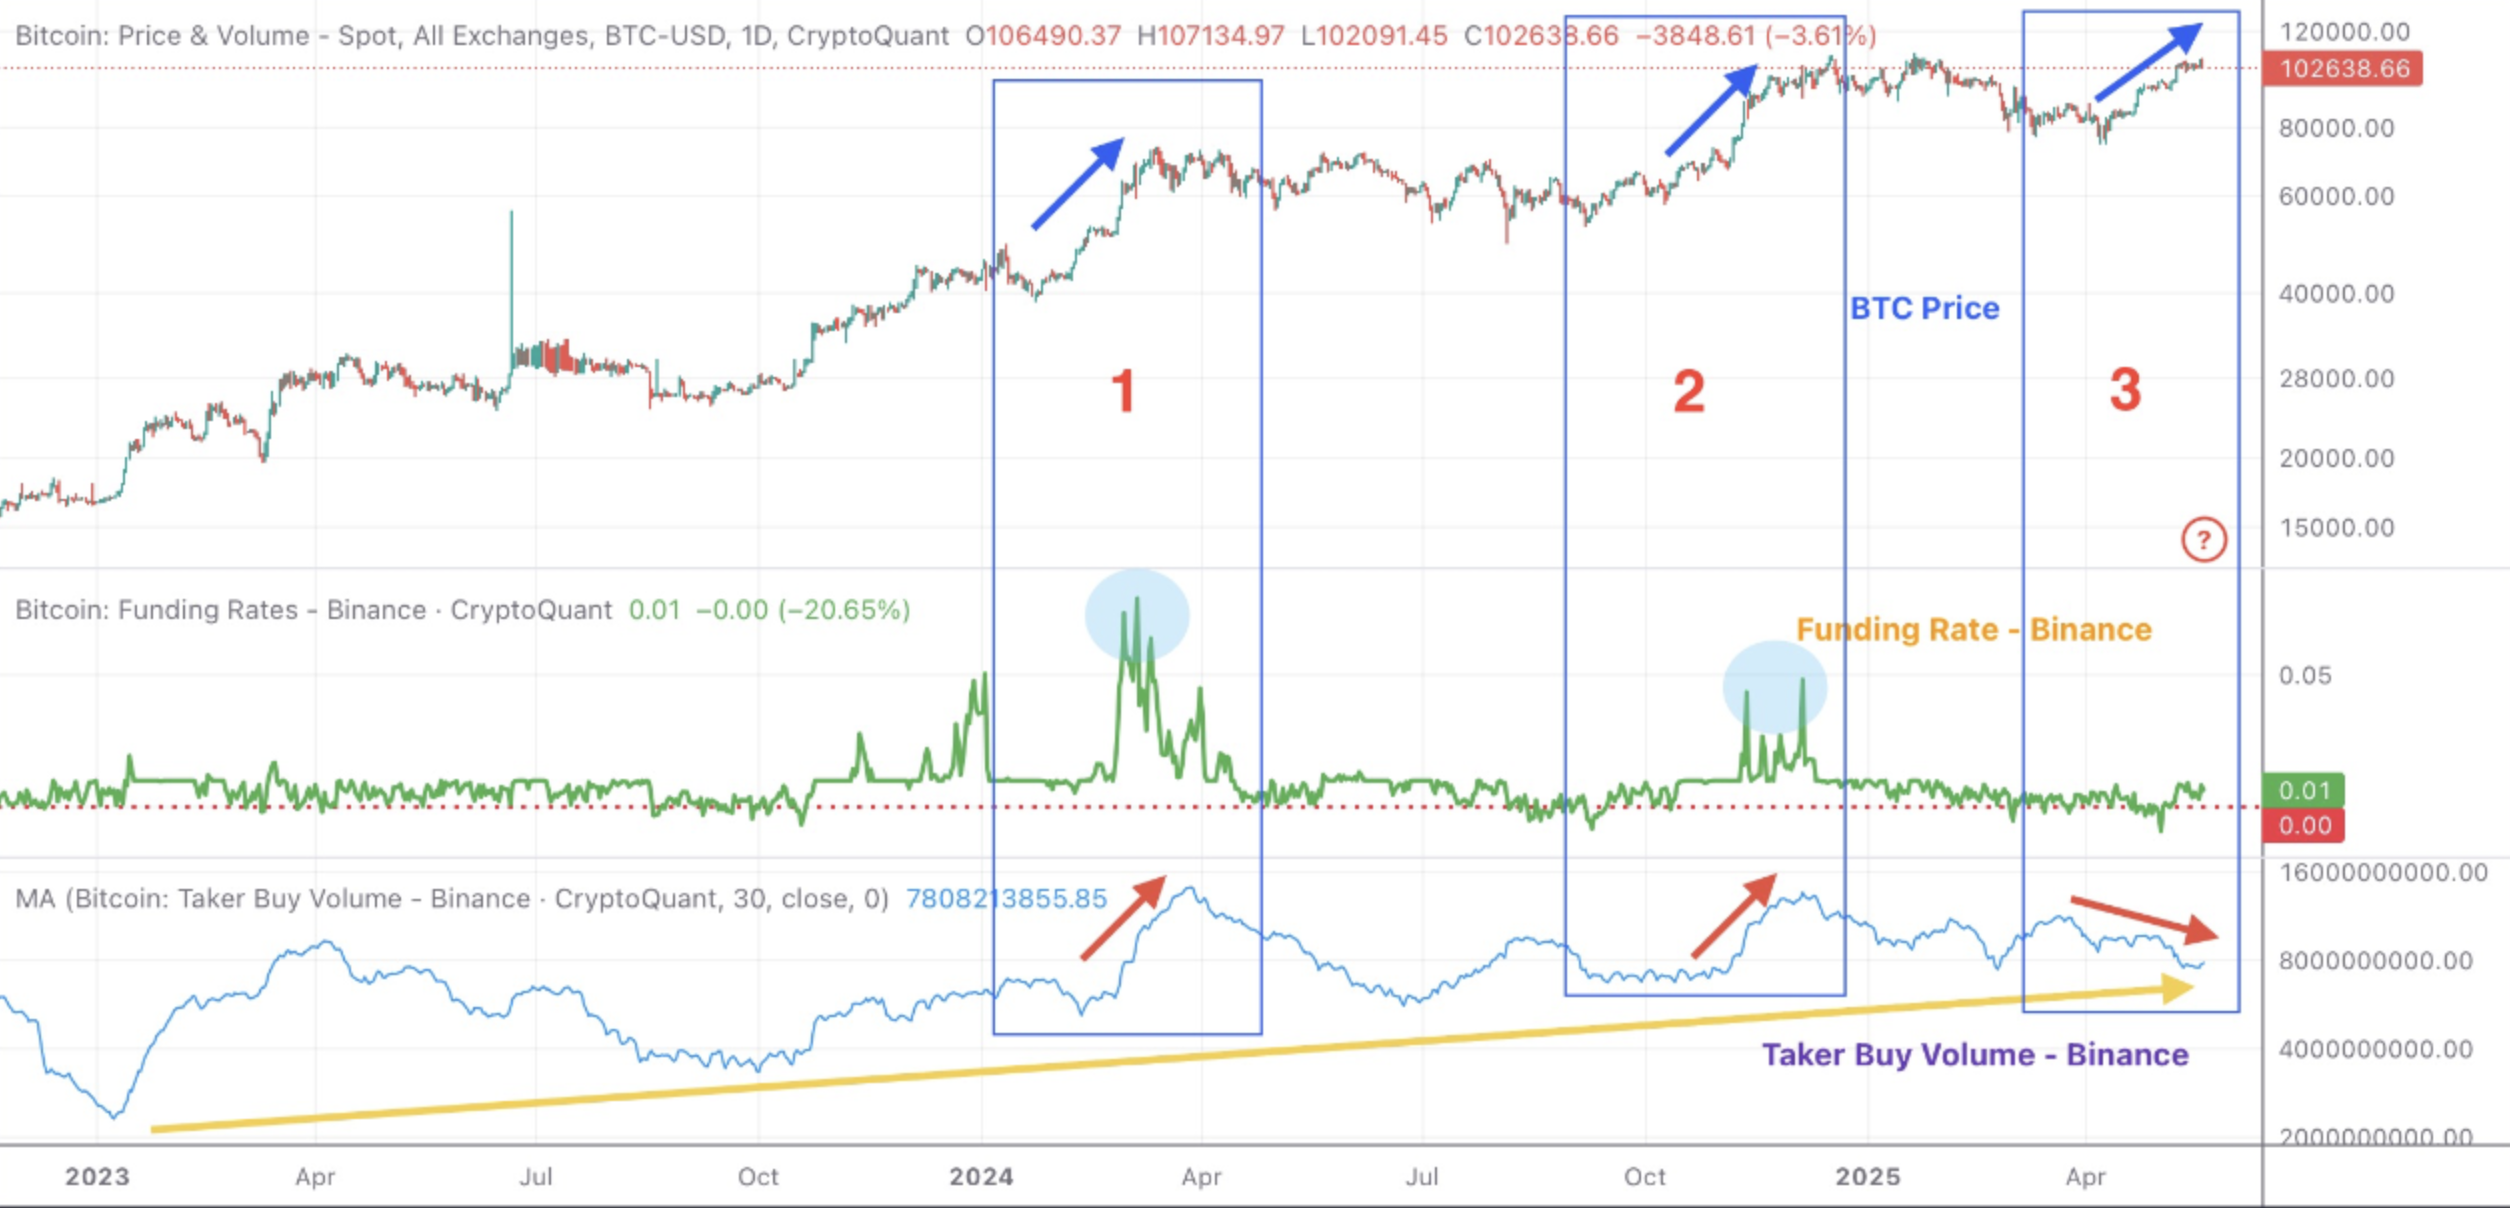
According to a recent CryptoQuant Quicktakes post by contributor avocado_onchain, last year’s BTC bull cycle – which saw the leading cryptocurrency create and break multiple all-time highs (ATHs) – was accompanied by sharp spikes in Binance market buy volume and funding rates.

Notably, a sudden increase in funding rates was twice followed by a sharp price pullback due to overheating. In this context, overheating refers to excessive bullish leverage in futures markets that drives up the cost of long positions, signalling overly aggressive sentiment that often precedes a market correction.

The following chart illustrates these corrections triggered by excessive leverage in BTC futures. Specifically, boxes 1 and 2 show sharp rises in Binance funding rates, initially accompanied by price increases, then extended periods of correction.

cq1

However, the current rally appears different. According to avocado_onchain, Bitcoin’s ongoing rebound is occurring without an overheated funding rate. In fact, Binance market buy volume is trending downward – as shown in box 3 of the chart – which contrasts with previous bull cycles.

The analyst argues that these are signs of a healthier rally, as earlier bull runs were marked by overheated funding rates and abrupt corrections, which weakened investor sentiment. In contrast, the current rally has maintained relatively stable funding rates, suggesting more cautious and sustainable market behavior.

Despite short-term price fluctuations, market buy volume has shown a steady upward trend since 2023, as marked by the yellow arrow in the chart. The analyst notes:

This indicates that buying sentiment remains favorable for further upside, suggesting that it’s not yet time to consider an exit. We can’t predict exactly when Bitcoin will break its previous high, but current on-chain and market data signals remain very constructive.

Other Indicators Point Toward New ATH

Besides the stable funding rates and encouraging market buy volumes, BTC is also showing several other positive signs pointing toward a new ATH for the flagship digital asset in the near future.

For example, on-chain data shows that long-term holders are not selling, even as BTC trades near its previous ATH of $108,786, recorded in January. This behavior suggests that these investors anticipate further upside.

That said, analysts caution against overly optimistic expectations, noting that Bitcoin may still be far from experiencing a true supply shock. At press time, BTC is trading at $102,393, down 1.4% in the past 24 hours.

bitcoin

Translate »